1 SRE Interview Questions and Answers
1. What is the difference between SRE and DevOps?
DevOps is a set of cultural philosophies and practices that aims to unify software development (Dev) and software operation (Ops).
Its goal is to shorten the system development life cycle and provide continuous delivery with high software quality
SRE, coined by Google, applies software engineering to infrastructure and operations problems.
It enforces reliability using measurable Service Level Objectives (SLOs), focuses on toil reduction, automation, and balancing reliability with feature velocity using error budgets.
SRE
- Origin: Introduced by Google
- Focus: Reliability, automation, monitoring
- Core Principles SLOs, SLIs, Error Budget
- Tooling Uses software engineering tools
DevOps
- Cultural movement
- CI/CD, collaboration
- Automation, culture, shared responsibility
- Emphasis on CI/CD pipelines, version control
2. What are SLIs, SLOs, and SLAs? How do they relate?
- SLI (Service Level Indicator): A quantitative measure of a service's performance.
Example: latency, uptime, request success rate.
- SLO (Service Level Objective): A target value for an SLI.
Example: “99.9% of requests should succeed in a 30-day window.”
- SLA (Service Level Agreement): A formal agreement between service providers and customers, including penalties for failing to meet the SLOs.
Relationship:
- SLIs → Used to measure service behavior
- SLOs → Targets based on SLIs
- SLAs → Contracts based on SLOs
3. What is an Error Budget and how do you use it?
An Error Budget is the allowable amount of downtime or failures a system can have without breaching the SLO.
It represents the balance between innovation and reliability.
If your SLO is 99.9% uptime over 30 days:
- Total minutes = 43,200
- Downtime allowed = 0.1% of 43,200 = 43.2 minutes
Usage:
- If the error budget is used up → halt feature releases, focus on reliability.
- If not used → can afford to take more risk (release features, experiments).
It enables data-driven decision making between ops and dev.
4. How do you implement monitoring for a distributed system?
Monitoring a distributed system involves collecting metrics, logs, and traces across services, components, and hosts. Implementation includes:
- Metric Collection: Use tools like Prometheus, Datadog, or CloudWatch to gather CPU, memory, latency, etc.
- Logging: Centralize logs with ELK (Elasticsearch, Logstash, Kibana), Fluentd, or Loki.
- Tracing: Implement distributed tracing using OpenTelemetry, Jaeger, or Zipkin.
- Dashboards: Visualize key metrics using Grafana or Datadog dashboards.
- Alerting: Set up alerts for SLO breaches, resource exhaustion, or abnormal behavior
Best Practices
- Define key SLIs (latency, availability)
- Use black-box and white-box monitoring
- Alert on symptoms, not causes
5. What are some common causes of high latency in web applications and how can you troubleshoot them?
Common Causes
- Database slow queries
- Application-level bottlenecks (e.g., loops, locking)
- Network issues (packet loss, congestion)
- Service dependency delays (e.g., upstream APIs)
Troubleshooting Steps:
- Use APM tools: Detect slow endpoints/functions.
- Check logs: Look for timeouts or retries.
- Query DB slow logs: Identify problematic SQL.
- Network diagnostics: Use traceroute, ping, mtr.
- Load testing: Use tools like JMeter, Locust to simulate traffic.
Fixes might include:
- Caching results (e.g., Redis)
- DB indexing
- Optimizing code
- Load balancing traffic
6. Describe a runbook. What should be included in a good runbook?
A runbook is a documented set of procedures for handling known operations or incidents.
Should Include:
- Description of the problem
- Preconditions or triggers
- Step-by-step resolution actions
- Validation steps post-fix
- Rollback plan
- Owner/team to escalate to
Example:
Runbook for “Disk Full on Web Server”
- Step 1: SSH into the server
- Step 2: Identify large files (
du -sh *) - Step 3: Archive or delete logs
- Step 4: Verify disk space
Benefits:
- Faster MTTR (Mean Time To Recovery)
- Reduces need for on-call escalation
- Ensures consistency
7. What is toil in SRE, and how can it be eliminated?
Toil is repetitive, manual, automatable, and non-value-add work that doesn't require human judgment.
Examples:
- Restarting failed services
- Manually rotating logs
- Handling routine tickets
Elimination Techniques:
- Automation: Write scripts, use Ansible/Terraform
- Self-healing: Use Kubernetes probes and auto-restart
- Better alerting: Suppress noise with smart alerts
- Bots: Use Slack bots for common actions
Goal is to keep toil < 50% of SRE workload
8. How would you design a high-availability architecture in a cloud environment?
Core Principles:
- Multi-Zone: Use multiple availability zones (AZs)
- Load Balancers: Distribute traffic across instances
- Auto-scaling: Maintain performance under load
- Stateless services: Easier to replicate
- Managed DBs: Use HA RDS, CosmosDB, etc.
- Health checks: Auto-restart failed nodes
Example in AWS:
- ALB → Auto Scaling Group with EC2 across 3 AZs
- Aurora DB with cross-AZ failover
- Route53 for multi-region DNS
Design should be resilient, scalable, and self-healing.
9. What are the differences between horizontal and vertical scaling? When would you use each?
Horizontal scaling is preferred in cloud environments because it’s more fault-tolerant and supports auto-scaling.
Vertical scaling is used when application architecture doesn’t support clustering or sharding.
10. Explain blue-green deployment and its benefits.
Blue-Green Deployment is a strategy where two environments (Blue = current, Green = new) are used.
- Deploy new version to Green.
- Test internally.
- Switch traffic from Blue to Green.
- Rollback by redirecting traffic back to Blue if needed.
Benefits:
- Zero downtime
- Easy rollback
- Safe experimentation
Used in CI/CD pipelines for risk mitigation during production releases
11. How do you ensure fault tolerance in a microservices architecture?
Fault tolerance ensures that the system continues functioning even if components fail.
Techniques:
- Retries with exponential backoff
- Circuit Breakers (e.g., Hystrix, Resilience4j)
- Bulkheads: Isolate failures to specific service components
- Fallback mechanisms: Return default values or cached data
- Health checks: Remove unhealthy instances from service mesh/load balancer
Best Practices:
- Monitor each microservice independently
- Use service meshes (like Istio) for traffic management
- Container orchestration (like Kubernetes) for resilience
12. What is chaos engineering, and why is it important?
Chaos engineering is the practice of intentionally injecting faults into a system to test its resilience.
Tools: Chaos Monkey, Gremlin, Litmus
Purpose:
- Identify weak points
- Validate alerting and monitoring
- Build confidence in production readines
Example Scenarios:
- Terminate instances randomly
- Block network between services
- Increase latency to simulate real-world conditions
Outcome: More resilient systems through proactive failure discovery
13. How do you handle noisy alerts?
Noisy alerts overwhelm engineers and lead to alert fatigue.
Solutions:
- Use deduplication and rate-limiting
- Apply threshold tuning on alerts
- Categorize alerts: P1 (urgent), P2 (important), etc.
- Implement alert silencing during maintenance
- Use machine learning-based anomaly detection for smarter alerting
- Only alert on symptoms, not causes
14. How does SRE measure the reliability of a system?
Reliability is measured through SLIs and SLOs, often based on:
- Availability (uptime): e.g., 99.99%
- Latency: e.g., 95% of requests < 200ms
- Durability: e.g., no data loss
- Error rate: e.g., < 0.1% failed requests
Metrics Tools:
- Prometheus
- CloudWatch
- New Relic
- Datadog
Reliability Score = How closely your system meets its SLOs.
15. What is MTTR, MTBF, and MTTD? Why are they important?
- MTTR (Mean Time to Repair): Time to fix a failure.
- MTBF (Mean Time Between Failures): Average uptime between failures.
- MTTD (Mean Time to Detect): Time to detect an issue after it occurs
Importance
- Helps track operational efficiency
- Indicates reliability trends
- Guides incident response planning
Lower MTTR and MTTD → faster recovery. Higher MTBF → fewer outages.
16. What is the difference between canary and rolling deployment?
Canary is better for risk detection.
Rolling is suitable for stable environments with minor changes.
17. How does Kubernetes help in SRE?
Kubernetes simplifies operations and enables reliability through:
- Auto-scaling: Horizontal and vertical
- Self-healing: Restart failed pods
- Rolling updates: Minimal downtime deployments
- Health checks: Liveness and readiness probes
- Namespaces & RBAC: Better isolation and security
SREs leverage Kubernetes to automate deployments, monitor workloads, and maintain service uptime efficiently.
18. What is a blameless postmortem, and why is it important?
A blameless postmortem focuses on learning from incidents without attributing fault to individuals.
- Encourages transparency
- Builds psychological safety
- Uncovers systemic weaknesses
Postmortem Includes:
- Summary of the incident
- Timeline
- Root cause analysis
- Action items
- Lessons learned
19. How do you handle database scaling in high-traffic systems?
Vertical Scaling:
Add more CPU/RAM to DB server (limited scalability)
Horizontal Scaling:
- Sharding: Split data across nodes
- Read Replicas: Distribute read traffic
- Caching: Use Redis/Memcached for frequent reads
- Connection pooling: Optimize database connections
Use proxy layers (like ProxySQL) and managed DB services (like Amazon Aurora) for easier scaling.
20. What is service mesh, and how does it help in observability?
A service mesh is an infrastructure layer that manages service-to-service communication.
Examples: Istio, Linkerd, Consul
- Traffic management (routing, retries)
- Security (mTLS)
- Observability (metrics, traces)
- Fault injection (chaos testing)
In Observability:
- Automatically collects telemetry data (latency, errors)
- Integrates with tracing and logging tools
- Enables fine-grained metrics per service
21. How do you reduce Mean Time to Recovery (MTTR)?
MTTR can be reduced by:
- Robust monitoring: Real-time alerts to catch issues quickly
- Runbooks: Fast, documented response
- Auto-remediation: Scripts to self-heal (e.g., restart services)
- Incident drills: Prepare responders via simulations
- CI/CD rollback: Enable rapid reversion to last known good state
Tooling: PagerDuty, Opsgenie, Lambda/Functions for automation
22. Describe a typical SRE on-call process.
- Alerting system (Prometheus, CloudWatch) detects an issue
- Notification sent to on-call engineer via PagerDuty, Opsgenie
- Engineer assesses logs, dashboards
- Mitigation: Hotfix, restart, or scale-out
- Escalate if necessary
- After issue → Postmortem created
Goals: fast detection, minimal downtime, documented
23. How do you handle secret management in production systems?
- HashiCorp Vault
- AWS Secrets Manager
- Azure Key Vault
- Kubernetes Secrets
Practices:
- Encrypt secrets at rest and in transit
- Rotate secrets regularly
- Use IAM for controlled access
- Never hardcode secrets in code or CI/CD
25. How do you conduct capacity planning?
- Gather metrics: CPU, memory, disk, traffic trends
- Forecast usage: Based on historical data and business growth
- Test scalability: Stress/load tests
- Plan buffer: Typically 30% headroom
- Reassess periodically
Tools: Grafana, CloudWatch, Datadog
26. What is observability? How is it different from monitoring?
Monitoring: Predefined metrics and alerts
Observability: Ability to understand internal system state from outputs (metrics, logs, traces)
3 Pillars of Observability:
- Metrics (quantitative)
- Logs (textual)
- Traces (request flows)
Observability helps debug unknown unknowns. Monitoring detects known issues.
27. How do you ensure zero-downtime deployments?
- Blue-Green or Canary deployments
- Load balancer health checks
- Readiness/liveness probes
- Preload containers before switching traffic
- Use rolling updates with maxSurge and maxUnavailable
Kubernetes and service meshes help manage zero-downtime rollouts.
28. What is infrastructure as code (IaC), and how does it benefit SREs?
IaC is managing infrastructure using code (declarative/imperative).
Tools: Terraform, Pulumi, AWS CDK, Ansible
Benefits
- Version control for infra
- Reproducibility and audit trails
- Easier testing and rollback
- Automation of provisioning
Enables GitOps workflows for environment management.
29. What is GitOps and how is it applied in SRE workflows?
GitOps uses Git as a single source of truth for infra and app config.
Process:
- Desired state in Git
- Git triggers deployment via agents (e.g., ArgoCD, Flux)
- Reconciliation loops correct drift
Benefits:
- Auditable changes
- Easy rollback
- Consistency across environments
30. How do you test disaster recovery in cloud systems?
Plan:
- Define RPO (Recovery Point Objective)
- Define RTO (Recovery Time Objective)
Testing:
- Simulate region outage
- Practice DB failovers
- Validate backup restores
- Chaos engineering for DR
31. Explain rate limiting and why it’s important.
Rate limiting restricts number of requests per client/service to prevent abuse or overload
Types:
- IP-based
- User-based
- Token-bucket algorithms
Tools: NGINX, Envoy, API Gateway
Prevents:
- DDoS
- API overuse
- Resource exhaustion
32. How do you ensure security in CI/CD pipelines?
Steps:
- Use static analysis tools (e.g., SonarQube, Checkov)
- Scan for secrets (e.g., truffleHog)
- Sign artifacts (e.g., Cosign)
- Use least privilege for CI/CD tokens
- Enable multi-factor authentication (MFA)
33. What’s the difference between a symptom-based and cause-based alert?
- Symptom-based Alerts on impact (e.g., high latency)
- Cause-based Alerts on root issue (e.g., CPU spike)
34. How do you handle cascading failures?
Cascading failures spread from one service to another
Prevention:
- Implement circuit breakers
- Add timeouts and retries
- Use bulkheads to isolate services
- Monitor dependency health
Service meshes can enforce limits to prevent overload
35. How does load shedding work?
Load shedding drops low-priority traffic during high load to protect the system
Methods:
- Reject requests with 503
- Queue overflow handling
- Prioritize traffic tiers (e.g., VIP vs free users)
Preserves system availability under stress.
36. What is distributed tracing and how do you use it?
Distributed tracing tracks requests across microservices
Tooling: OpenTelemetry, Jaeger, Zipkin
Use Case
- Find latency bottlenecks
- Diagnose service dependencies
- Correlate logs and spans
Output: Span trees with timestamps and service names
37. What is the principle of least privilege in access control?
Only give access necessary for a user/app to perform their task.
Applies to:
- IAM roles
- Kubernetes RBAC
- API keys and credentials
Improves security and reduces breach impact.
38. How do you track configuration drift?
Configuration drift occurs when systems diverge from declared state.
Solutions:
- IaC enforcement (Terraform, Ansible)
- GitOps reconciliation loops
- Drift detection tools (e.g., Terraform Plan)
Automated alerts and enforcement reduce risk.
39. What is alert fatigue and how do you combat it?
Alert fatigue happens when engineers receive too many irrelevant alerts.
Solutions:
- Triage alerts into severity levels
- Silence non-critical alerts
- Use better thresholds and anomaly detection
- Run weekly alert review meetings
Keep alerts actionable and minimal.
40. Describe the incident lifecycle.
- Detection (monitoring/alerts)
- Response (triage, mitigation)
- Resolution (restore service)
- Postmortem (blameless, documented)
- Action Items (to prevent recurrence)
Tools: PagerDuty, Slack, Statuspage
41. How do you design a high-availability system?
High availability (HA) ensures minimal downtime. Key components:
- Redundancy: Use multiple instances/load balancers
- Failover mechanisms: Auto switch on failure
- Health checks: Remove unhealthy nodes
- Geographic distribution: Multi-region or zone setup
- Stateless design: Easier failover
Use services like AWS ALB, Azure Availability Zones, or Kubernetes with anti-affinity rules.
43. How do you scale systems to handle sudden traffic spikes?
Strategies:
- Auto-scaling groups (AWS ASG, K8s HPA)
- Queueing mechanisms (SQS, RabbitMQ)
- CDN offloading (Cloudflare, Akamai)
- Caching (Redis, Varnish)
- Pre-warm critical services (Lambda provisioned concurrency)
Plan ahead with load testing and scale limit
44. What’s the purpose of an error budget, and how do you enforce it?
Error budget = 100% - SLO target (e.g., 99.9% SLO → 0.1% budget for failure)
Usage
- Track system reliability
- Pause deployments if budget exhausted
- Encourage balance between innovation and reliability
Monitored via dashboards; decisions tied to deployment frequency
45. How do you handle ephemeral environments for testing?
Ephemeral environments are temporary, disposable staging/test setups.
Tools:
- Terraform with short TTL
- Preview environments via CI (e.g., GitHub Actions, GitLab)
- Use Kubernetes namespaces per PR
Benefits: consistent testing, cost efficiency, no long-lived test infra
46. How do you monitor service dependencies in microservices?
- Distributed tracing (OpenTelemetry, Jaeger)
- Service mesh observability (Istio, Linkerd)
- Dependency graphs (e.g., Dynatrace, New Relic)
49. What is auto-remediation, and give examples.
Auto-remediation automates incident response without human intervention.
Examples:
- Restart a crashed pod via K8s liveness probe
- Auto scale on high CPU usage
- Replace failed EC2 instance using ASG
- Lambda function to restart service on failure alert
Helps reduce MTTR and improve uptime.
50. How do you prepare for major product launches from an SRE perspective?
- Load testing: Predict traffic behavior
- Chaos drills: Validate resilience
- Capacity planning: Scale resources ahead
- Rollback plan: Tested and ready
- Observability checks: Dashboards, alerts verified
- On-call rotation: Adjusted for event
51 Monitoring & Observability in DevOps
Visibility into infrastructure, applications and business is the Key to reliable and scalable systems.
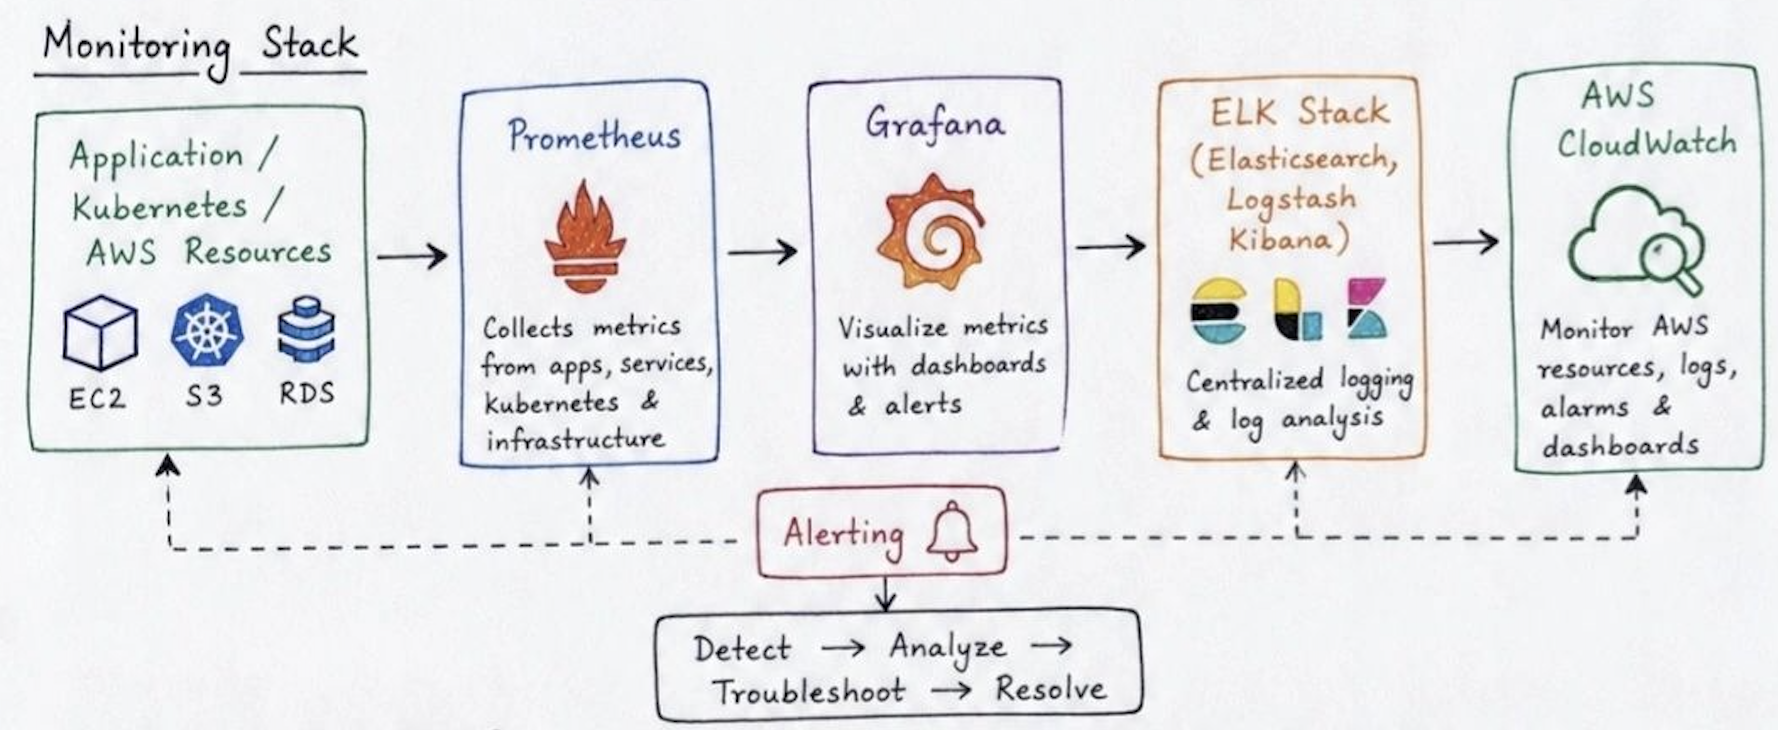
What each tool does?
Prometheus: Collects real-time metrics from targets.
Grafana: Visualizes metrics and helps in trend analysis.
CloudWatch: Monitors AWS resources, collects logs & sends alarms.
ELK Stack: Centralizes logs from applications & infrastructure for search and analysis.
Real Production Scenario
- Check Grafana → CPu / Memory/ Response time high?
- Check Prometheus → Which pod / service is having high error or latency?
- Check ELK → Any application errors or exceptions in logs?
- Check CloudWatch → Any issue inAWS infrastructure?
- Identify root cause and fix the issue.
Benefits
- Real-time visibility
- Faster incident detection
- Better performance tracking
- Proactive alerting
- Improved system reliability
52 Linux Shell Scripting — DevOps Interview Notes
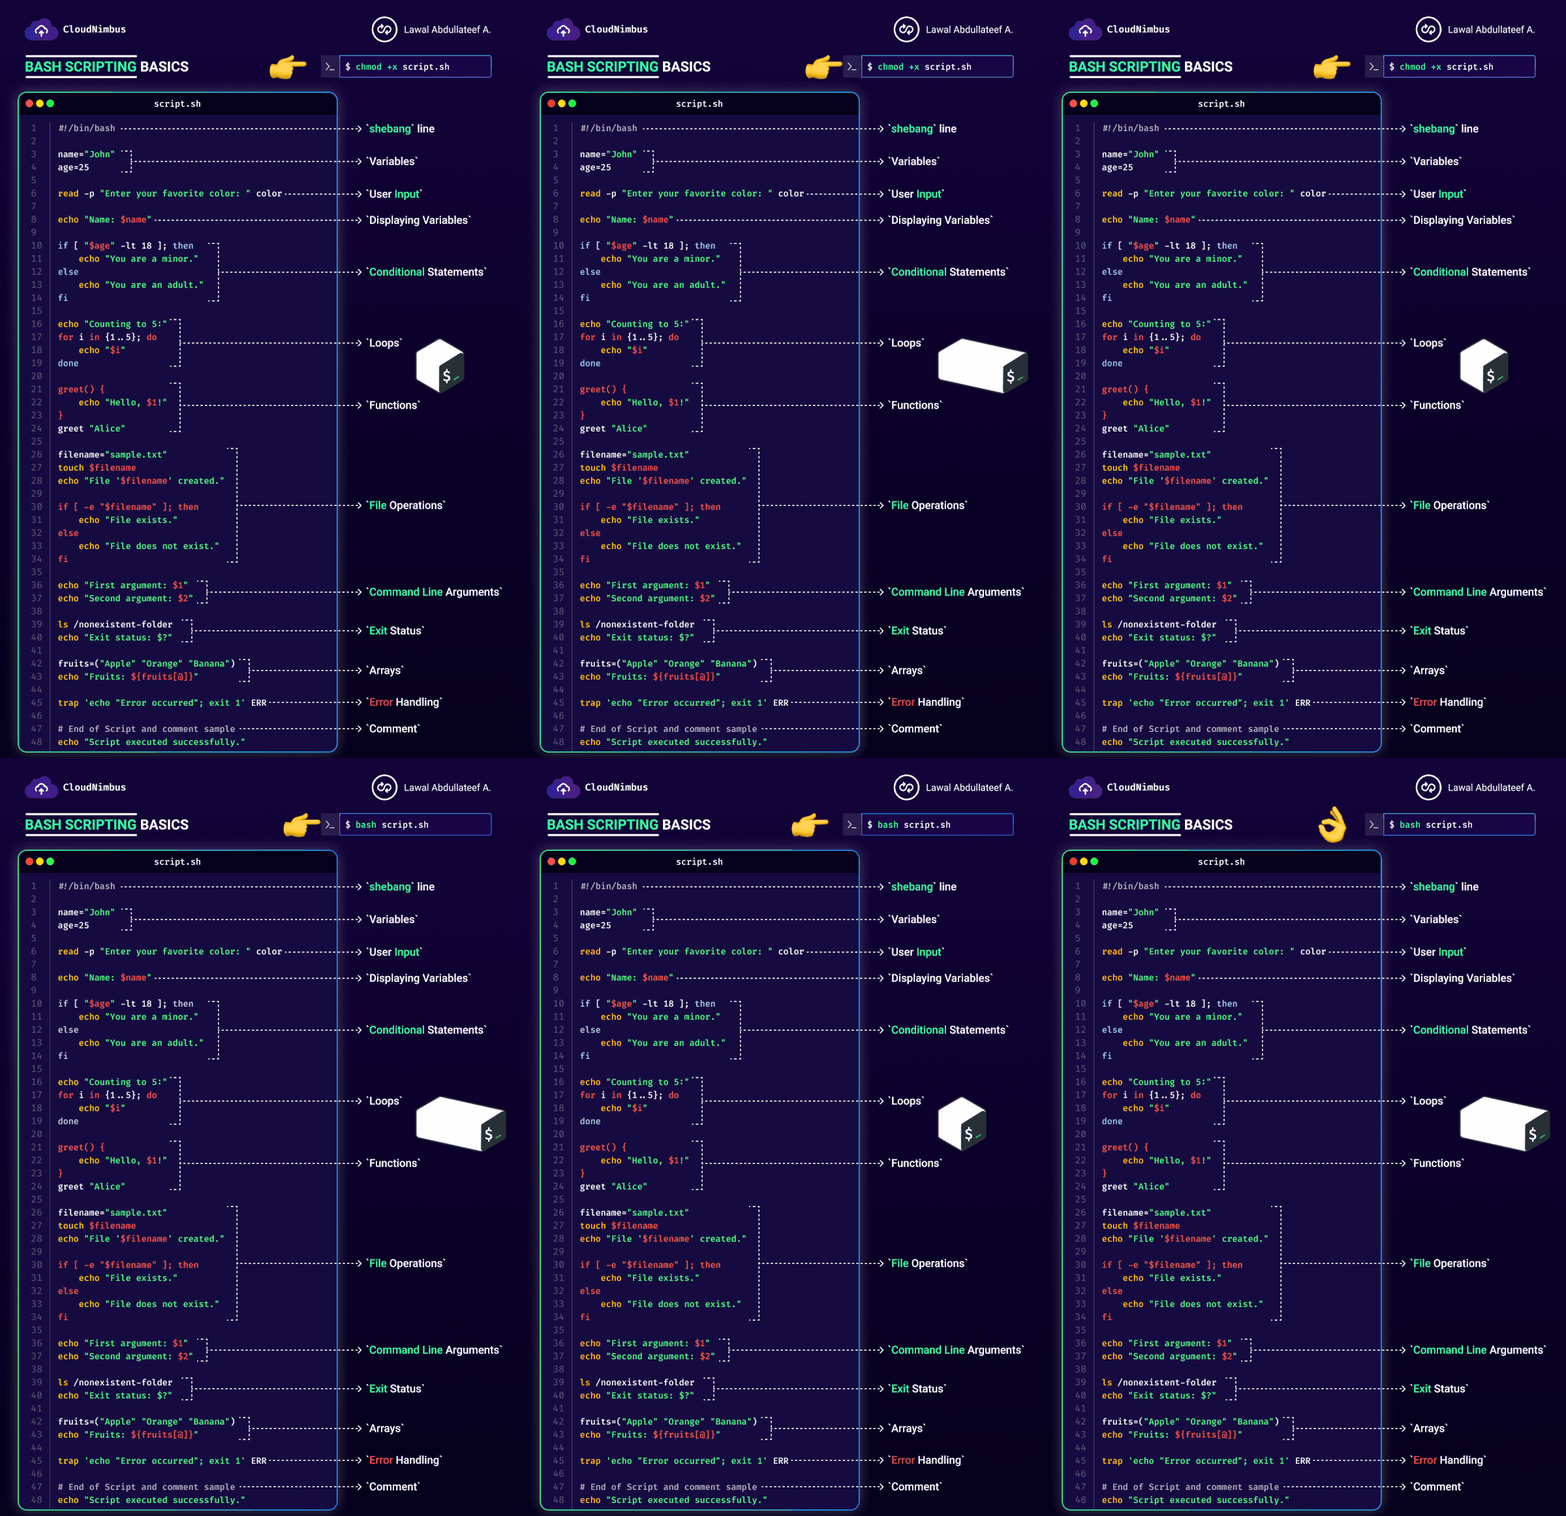
- Shebang
#!/bin/bash
Defines Bash as the script interpreter.
- Variables & User Input
name="John"
age=25

read -p "Enter your favorite color: " color
echo "Name: $name, Color: $color"
Interview: Bash variables do not use spaces around =.
3. Conditional Statements
if [ "$age" -lt 18 ]; then
    echo "Minor"
else
    echo "Adult"
fi
Common operators:
-eq  equal
-ne  not equal
-lt  less than
-le  less/equal
-gt  greater than
-ge  greater/equal
-e   file exists
-f   regular file
-d   directory exists
4. Loops
for i in {1..5}; do
    echo "$i"
done
Useful for automation, such as processing servers, files, or pods.
5. Functions
greet() {
    echo "Hello, $1"
}

greet "Alice"
$1 = first argument passed to the function.
6. File Operations
filename="sample.txt"

touch "$filename"

if [ -e "$filename" ]; then
    echo "File exists"
fi
Common commands:
ls
cp
mv
rm
touch
cat
7. Command-Line Arguments
echo "First argument: $1"
echo "Second argument: $2"
Example:
./script.sh server1 production
Then:
$1 = server1
$2 = production
$# = number of arguments
$@ = all arguments
8. Exit Status
ls /nonexistent-folder
echo "Exit status: $?"
Important:
0       = success
non-zero = failure
$?      = exit status of previous command
Very important for CI/CD scripts.
9. Arrays
fruits=("Apple" "Orange" "Banana")

echo "${fruits[0]}"
Output:
Apple
10. Error Handling
trap 'echo "Error occurred"; exit 1' ERR
Can be used to catch command failures and perform cleanup/error handling.
A common DevOps pattern is:
set -e
set -u
set -o pipefail
This makes scripts fail more safely.
11. Comments
# This is a comment
echo "Hello"
🔥 DevOps Interview Must-Know Bash
| Topic | Key Point | ||
|---|---|---|---|
#!/bin/bash |
Shebang/interpreter | ||
$var |
Variable | ||
$1, $2 |
Script arguments | ||
$? |
Previous command exit status | ||
$# |
Number of arguments | ||
$@ |
All arguments | ||
if |
Conditional logic | ||
for / while |
Loops | ||
function |
Reusable code | ||
-e |
File exists | ||
-f |
Regular file | ||
-d |
Directory | ||
&& |
Run next command if success | ||
| | |
Run next command if failure | ||
> |
Redirect/overwrite | ||
>> |
Redirect/append | ||
\| |
Pipe output | ||
grep |
Search text | ||
awk |
Text/data processing | ||
sed |
Text replacement | ||
chmod +x |
Make script executable |
Typical DevOps example
#!/bin/bash

if systemctl is-active --quiet nginx; then
    echo "Nginx is running"
else
    echo "Nginx is down"
    systemctl start nginx
fi
Interview answer:
Bash scripting is commonly used in DevOps to automate deployment, server administration, health checks, log processing, backups, and CI/CD tasks.
End-to-End Flow: What Happens When a User Types google.com in a Browser
User types google.com
        │
        ▼
┌──────────────────┐
│  DNS Resolution  │  ← cache → resolver → root → TLD → auth NS
└────────┬─────────┘
         ▼
┌──────────────────┐
│  TCP Handshake   │  ← SYN / SYN-ACK / ACK
└────────┬─────────┘
         ▼
┌──────────────────┐
│  TLS Handshake   │  ← ClientHello / ServerHello / Cert / Finished
└────────┬─────────┘
         ▼
┌──────────────────┐
│  HTTP Request    │  ← GET / HTTP/2
└────────┬─────────┘
         ▼
┌──────────────────┐
│  CDN / LB / WAF  │  ← edge routing, caching, security
└────────┬─────────┘
         ▼
┌──────────────────┐
│  Origin Server   │  ← app logic, backends, DB
└────────┬─────────┘
         ▼
┌──────────────────┐
│  HTTP Response   │  ← 200 OK + HTML
└────────┬─────────┘
         ▼
┌──────────────────┐
│ Browser Render   │  ← DOM, CSSOM, JS, paint
└──────────────────┘
1. DNS Resolution
Browser checks cache → OS cache → /etc/hosts → recursive resolver → root → .com TLD → Google's authoritative NS. Returns IP address.
2. TCP Handshake
Client opens TCP connection to that IP on port 443 (3-way handshake: SYN → SYN-ACK → ACK).
Client ──SYN──────────►  Server
Client ◄──SYN-ACK──────  Server
Client ──ACK──────────►  Server
3. TLS Handshake
Client and server negotiate encryption (TLS 1.3, 1-RTT). Client verifies the server's certificate.
Client ──ClientHello (+ key share)────► Server
Client ◄──ServerHello + Certificate─── Server
Client ──Finished─────────────────────► Server
Client ◄──Finished───────────────────── Server
4. HTTP Request
Browser sends GET / HTTP/2 with headers (Host, User-Agent, Cookies, etc.).
5. Server-Side Processing
Request hits CDN edge → load balancer → application server → backend services (search, ads, etc.).
Response is generated and cached.
6. HTTP Response
Server returns 200 OK with HTML, headers (caching, security), and body.
7. Browser Rendering
Browser parses HTML → builds DOM → fetches subresources (CSS, JS, images) → layout → paint → page interactive.
One-Line Summary
DNS → TCP → TLS → HTTP request → server processing → HTTP response → browser render.
Failure Points & SRE Mitigations
| Stage | Failure | Mitigation |
|---|---|---|
| DNS | NXDOMAIN, timeout | Anycast, multiple resolvers, low TTL |
| TCP | SYN drop, refused | Health checks, LB failover |
| TLS | Expired cert | Automated rotation, expiry alerts |
| LB | 502/503/504 | Multi-region, health checks |
| App | 500, timeout | Circuit breakers, retries, bulkheads |
| CDN | Cache miss storm | Pre-warming, stale-while-revalidate |
| Client | Slow render | RUM, perf budgets, CDN |
Observability Signals to Monitor
| Layer | Metric | Tool |
|---|---|---|
| DNS | Query latency, NXDOMAIN rate | dig, CoreDNS metrics |
| Network | RTT, packet loss, retransmits | mtr, tcpdump, eBPF |
| TLS | Handshake time, cert expiry | openssl, blackbox_exporter |
| LB | 5xx rate, latency p99 | NGINX/Envoy metrics |
| App | Request rate, error rate, latency | Prometheus, OpenTelemetry |
| Infra | CPU, memory, disk, network | Node exporter, cAdvisor |
| Client | LCP, INP, CLS | RUM, Lighthouse |
Production Troubleshooting
1. The Senior Troubleshooting Loop
-
The Process (8 Steps):
- Symptom: What is happening?
- Scope: How big is the impact?
- Evidence: Collect data (logs, metrics, traces, etc.).
- Hypothesis: What could be the cause?
- Test: Verify your hypothesis.
- Cause: Identify the root cause.
- Fix: Implement the solution.
- Verify: Confirm the issue is resolved and monitor.
-
Note: If not resolved, repeat the loop.
- Quote (right side): "Good engineers find the cause. Great engineers prevent it from happening again." — VERIOTA
2. What Changed?
- Focuses on identifying recent changes that might have caused the issue.
- Check recent deployments, configuration changes, infrastructure changes (scaling, instance replacement), and recent code commits.
- Identify changes in dependencies (database, third-party services).
- Use change logs, deployment tools, and monitoring timelines.
Graphic: Magnifying glass over a document. Text: "Recent Changes Often Explain the Problem."
3. Determine Blast Radius
- Assess the extent of the impact before acting.
- Is it affecting one user, one service, or the entire system?
- Which regions, AZs, or clusters are impacted?
- Is it limited to a specific feature or global?
- Identify affected users, services, and dependencies.
Graphic: Red concentric circles (bullseye). Text: "Understand the Impact Before You Act."
4. Application vs Infrastructure Failures
- Differentiates between types of failures to narrow down the search.
- Application failures: Bugs, memory leaks, unhandled exceptions, bad requests.
- Infrastructure failures: Compute, network, storage, load balancers, DNS, cloud provider issues.
- Check both layers, as it can be a combination.
Graphic:
</>(Application Code, Logic, Data) VS Server icon (Infrastructure Servers, Network, Cloud).
5. Logs, Metrics, Traces and Events
- Logs: Look for errors and patterns.
- Metrics: Check CPU, memory, latency, error rates, etc.
- Traces: Follow the request across services.
- Events: Check system and cloud events (AWS Health, Kubernetes events).
- Correlate all signals using timestamps.
Graphic: Flowchart showing Logs -> Metrics -> Traces -> Events.
6. Dependency Failures
- Highlights that issues often stem from downstream services.
- Check external services (databases, APIs, message queues, caches).
- Verify service endpoints, DNS, and connectivity.
- Look for authentication, rate limits, or timeouts.
- Check if a dependency is slow or returning errors.
Graphic: Database, Cloud, and Chain Link icons. Text: "A Downstream Service Can Break Your System."
7. Network Failures
- Focuses on network-related issues.
- Check DNS resolution.
- Verify connectivity and routing (VPC, subnets, security groups).**
- Look for firewall or network policy blocking traffic.
- Check load balancers and health checks.
- Use tools like ping, traceroute, curl, and VPC flow logs.
Graphic: Globe with a disconnection symbol. Text: "No Network No Service."
8. Resource Exhaustion
- Identifies issues caused by running out of resources.
- Check CPU, memory, disk, and network utilization.
- Look for memory leaks, high GC, or disk full.
- Verify pod/instance limits and quotas.
- Check for resource contention (e.g., noisy neighbor).
Graphic: CPU chip, RAM, and Disk icons. Text: "When Resources Run Out Systems Fail."
9. Configuration Changes
- Highlights that small config errors can cause big problems.
- Review application and infrastructure configuration.
- Check environment variables, feature flags, and secrets.
- Look for misconfigurations in IDs, endpoints, or permissions.
- Validate configuration management tools (e.g., Terraform, Ansible).
Graphic: Document with a gear. Text: "A Small Misconfiguration Can Cause a Big Outage."
10. Deployment-Related Failures
- Focuses on issues arising from new releases.
- Check deployment status and rollout history.
- Verify if new version introduced a bug.
- Look for failed or partial deployments.
- Confirm database schema changes.
- Check if rollback is possible and safe.
Graphic: Circular refresh arrows. Text: "Deployments Can Introduce Risk Always Monitor After a Release."
11. Avoid Changing Five Things Simultaneously
- Advises a methodical approach to fixing issues.
- Change one thing at a time.
- Otherwise, you won't know what fixed it.
- Keep a record of every change.
- Use a rollback plan.
- Be methodical and patient.
Graphic: Tools crossed out. Text: "One Change at a Time Find the Real Fix."
12. Preserve Evidence Before Restarting Everything
- Emphasizes the importance of data collection before taking action.
- Collect logs, metrics, and traces first.
- Take screenshots and save error messages.
- Capture system state (e.g., describe commands).
- Store evidence in a central location.
- Do not immediately restart services unless necessary.
Graphic: Database cylinder with a checkmark. Text: "Evidence Helps You Find the Real Cause."
13. Key Takeaways
- Use a structured approach.
- Understand what changed.
- Determine the blast radius.
- Check application and infrastructure.
- Use logs, metrics, traces, and events.
- Investigate dependencies, network, resources, and configurations.
- Avoid changing multiple things.
- Preserve evidence.
- Learn and prevent recurrence.
Cost Optimization and FinOps
- Cloud Cost Fundamentals — know the pricing model and main cost drivers (compute, storage, network, databases, managed services); use cost tools (Cost Explorer, Azure Cost Management); set budgets and alerts.
- Compute Utilization — monitor CPU/memory, right-size, use autoscaling.
- Storage Cost — match storage class/tier to the use case (e.g., S3 Standard vs Glacier), lifecycle policies, delete unused/old data.
- Network/Data Transfer — inter-region and internet egress is expensive; co-locate resources, use CDNs, watch ingress/egress.
- Kubernetes Cost — right-size pods/requests, cluster autoscaling, remove idle namespaces, monitor with Kubecost.
- Idle Resources — biggest quick win: delete unused instances, volumes, load balancers, IPs; schedule non-prod environments off.
- Rightsizing — continuous, data-driven instance sizing.
- Reserved Capacity — RIs, Savings Plans, CUDs for predictable workloads; review commitments regularly.
- Autoscaling — scale on metrics (CPU, memory, requests), avoid over-provisioning.
- Observability Cost — logs/traces get expensive at scale; retention periods, sampling, right-tier storage.
- Cost Attribution — tagging (team, env, project, cost center) + cost allocation reports for accountability.
- Reliability vs Cost — higher reliability costs more; right-size the SLA to the business need; avoid over-engineering.
- Performance vs Cost — faster usually costs more; cache, CDN, right-sized infra; measure improvement vs spend.
- Build vs Buy — managed services reduce ops burden, may cost more; in-house can be cheaper but needs expertise; think TCO.
- Financial Consequence — every architecture decision has a cost impact; think long-term operational cost, not just initial build.
Resilience and Disaster Recovery
- Failure Domains — know what can fail (instance, AZ, region); isolate critical components so one failure doesn't cascade; limit blast radius.
- Redundancy — eliminate single points of failure; multiple instances/AZs/regions; redundancy buys availability and fault tolerance.
- Backups — data, config, and critical resources; 3-2-1 rule (3 copies, 2 media, 1 offsite); automate and monitor backups.
- Restore Testing — a backup you haven't restored is untested; verify regularly in a non-prod environment; document the process.
- RTO — max acceptable time to restore service; lower RTO = more investment; "How fast must we recover?"
- RPO — max acceptable data loss; lower RPO = more frequent backups/replication; "How much data can we lose?"
- Multi-AZ Architecture — deploy across AZs in one region; survives single-AZ failure automatically; use managed services (RDS Multi-AZ, EKS, ALB); watch for cascading failures.
- Multi-Region Architecture — for regional disasters; replication + global DNS (e.g., Route 53); more complexity, higher availability.
- Failover — automatic or manual switch to healthy system; health checks + monitoring; test it regularly; ensure data consistency after.
- Dependency Failures — map critical dependencies (databases, APIs, third parties); monitor them; plan timeouts, retries, fallbacks; avoid cascading failures.
- Circuit Breakers — stop calling a failing service; let it recover; combine with retries/fallbacks; prevent failure spread.
- Retries & Exponential Backoff — retry with increasing delays; add jitter; cap retry counts; avoid overwhelming a struggling service.
- Graceful Degradation — keep core functionality alive during partial failures; serve cached/read-only data; prioritize critical user journeys; communicate status clearly.
- DR Exercises — run regular drills; test failover and full restore; validate RTO/RPO targets; involve the whole team; update runbooks from lessons learned.
- A Backup You Have Never Restored Is an Assumption — unverified backups can be corrupt or incomplete; restore testing is the only proof; document results and fix issues. Verify, don't assume.
Performance and Capacity Engineering
Foundations (1–4)
- Latency — time for a request to get a response; measure end-to-end (app, network, DB); high latency hurts UX; find where it's introduced.
- Throughput — requests/tasks processed per unit time; measure RPS/TPS; increase by removing bottlenecks and scaling.
- Saturation — resource at/near its limit → higher latency, errors, timeouts; monitor CPU, memory, disk, network; add capacity or optimize before saturation impacts users; high utilization = higher risk.
- CPU — handles processing and system tasks; high CPU → slow responses, timeouts; monitor usage, load average, throttling; watch for CPU spikes and sustained high usage.
Resources (5–8)
- Memory — fast data access; leaks cause slowdowns/crashes; monitor usage, swap, OOM events; right-size and fix leaks.
- Disk I/O — affects read/write performance; high disk latency slows DBs and apps; monitor IOPS, latency, throughput; match storage type (SSD/gp3/io2) to workload.
- Network Throughput — data transferred per second; monitor bandwidth, packet loss, network latency; bottlenecks hurt app performance; proper network design, load balancers, routing.
- Connection Limits — every system caps concurrent connections (e.g., database server); exceeding limits → timeouts/errors; tune connection pools, adjust limits, monitor active/idle connections.
Bottlenecks & Testing (9–12)
- Queue Depth — queues hold requests when systems are busy; monitor queue length and processing time; growing queues signal downstream bottleneck; alerts for abnormal queue growth.
- Bottlenecks — limit overall system performance; can be CPU, memory, disk, network, database, or external services; use metrics, tracing, profiling to find them; fix the real bottleneck, not just symptoms.
- Load Testing — simulate real traffic to test capacity; identify bottlenecks and breakpoints; test normal load, peak load, failure scenarios; tools: k6, JMeter, Locust.
- Capacity Planning — estimate future resource needs based on growth; use historical data and trends; consider seasonal spikes and business events; plan for headroom to avoid last-minute scaling.
Proactive Operations (13–16)
- Autoscaling Signals — use real metrics (CPU, memory, custom metrics, queue depth) to trigger scaling; set thresholds and cooldown periods; test autoscaling policies.
- Resource Requests and Limits — set resource requests to reserve capacity; set limits to prevent resource abuse; helps with stability, fairness, cost control (e.g., Kubernetes); monitor and adjust based on real usage.
- Performance Baselines — establish baseline metrics when the system is healthy; track normal performance patterns (latency, CPU, RPS); use baselines to detect anomalies and regressions; update baselines as the system evolves.
- Know What Normal Looks Like — you cannot troubleshoot effectively without knowing normal behavior; monitor key metrics, logs, and patterns; compare current behavior to baseline to quickly spot issues; always ask: "Is this normal for our system?"
SRE Incident Response & Troubleshooting
1 You discover that a recent config change was deployed without proper testing. The system is unstable. How do you respond?
First, identify the change using version control or deployment logs to understand what was altered. Communicate with stakeholders immediately to inform them of the issue. Attempt a rollback if the change is reversible and known to be the cause.
If rollback is not feasible, deploy a hotfix to stabilize the system. Implement a temporary mitigation to reduce impact while a permanent fix is developed.
After the incident, conduct a post-mortem to reinforce pre-deployment validation, code reviews, and automated testing policies
2 Your service is intermittently returning 403 errors to authenticated users. How do you debug and resolve this?
Start by verifying authentication and authorization systems:
- check if access tokens are valid and haven't expired.
- Review logs for 403 errors and identify affected users.
- Inspect access control logic in code or policies to ensure correct permissions are applied.
- Investigate recent changes in IAM roles, reverse proxy configurations, and WAF rules.
- Use A/B testing or rollback to validate if a recent change caused the issue.
3 A traffic spike is causing cascading failures in your microservices. How do you stabilize the system?
- Begin by activating rate limiting to control incoming traffic and avoid overloading services.
- Enable circuit breakers to prevent overworked services from impacting others.
- Temporarily scale up critical services or use caching/CDNs to offload traffic.
- Use a load balancer to shed non-essential load.
- Once stabilized, perform root cause analysis and implement auto-scaling rules and service isolation to prevent recurrence
4 You receive alerts during a region-wide cloud provider outage. What’s your course of action?
- Immediately verify the extent of the outage via status pages and logs.
- If multi-region support is in place, initiate failover to an unaffected region.
- Communicate with customers about the outage and mitigation steps.
- Update DNS configurations or use traffic director services to reroute traffic.
- After restoration, audit disaster recovery plans and ensure better redundancy.
5 A rollback didn’t resolve a production issue. What’s your next step?
- Validate that the rollback was successful and all related components were included.
- Investigate logs for any new or persisting errors.
- Consider non-code causes like corrupted data, environment mismatches, or background jobs.
Escalate the incident with a war room approach, involving cross-functional teams. Use observability tools to trace the problem and plan a new remediation strategy.
6 Your CDN is returning stale content after a deployment. How do you troubleshoot?
- Purge the CDN cache manually or via its API.
- Review cache-control headers and ensure they are correctly configured.
- Verify if content versioning is used; if not, implement it using file hashes or query strings.
- Monitor the CDN for cache hit/miss rates to validate the fix.
7 An internal service has exceeded its API rate limits. How do you resolve it and prevent recurrence?
- Throttle or queue requests to reduce load on the API.
- If external, contact the API provider for temporary relief.
- Implement exponential backoff and retry logic.
- Monitor usage patterns and apply quotas to internal clients.
- Long-term, work on optimizing request frequency and introducing caching where possible.
8 A monitoring tool itself has gone down. How do you ensure visibility during the incident?
- Fallback to alternative monitoring like cloud-native metrics, system logs, or backup observability stacks.
- Deploy lightweight agents that push logs/metrics to a temporary dashboard.
- Prioritize restoring the main monitoring system and ensure its future availability by setting up redundancy and health checks.
9 Your application suddenly has a spike in retries and timeouts. What’s your investigative strategy?
- Start by analyzing metrics and logs to pinpoint where the timeouts occur.
- Use distributed tracing to identify slow or failing dependencies.
- Validate network performance and DNS resolution.
- Check if retries are causing a feedback loop.
- Investigate recent deployments or changes that could be affecting latency.
2 Reliability & Performance Optimization
1 Your system is hitting database connection pool limits. How do you investigate and mitigate?
- Start by examining application logs and DB metrics to confirm connection exhaustion.
- Use connection pool monitoring tools to identify connection leaks or long-running queries.
- Optimize queries and database indexing. If appropriate, increase pool size, and introduce caching to reduce load.
- Consider horizontal scaling (read replicas) to distribute read traffic
2 A regional failover succeeded, but users reported increased latency. What improvements would you make?
- Review DNS TTLs and global routing policies.
- Evaluate whether the backup region’s infrastructure is warm or cold-start.
- Pre-warm instances, replicate caches, and sync data to reduce failover time.
- Implement geo-based routing or anycast to serve users from the nearest healthy location.
3 A memory-intensive process is causing GC thrashing. How would you fix this?
- Use profiling tools to analyze heap usage and identify memory leaks or excessive object creation.
- Tune JVM/GC parameters or experiment with different garbage collectors.
- Refactor the code to reduce memory pressure and optimize object lifecycle management
4 Your app needs to support zero-downtime deployments, but users experience brief disruptions. How do you fix that?
- Switch to deployment strategies like blue-green or canary releases.
- Ensure proper load balancer configuration to drain connections before shutting down old instances.
- Configure readiness and liveness probes to avoid routing traffic to unhealthy pods/instances during rollout.
5 How would you introduce chaos testing into a mission-critical environment?
- Begin in non-production environments to validate resilience. Use tools like Chaos Mesh or Gremlin.
- Start with basic failure scenarios like network latency or service termination.
- Gain stakeholder buy-in, then gradually expand chaos coverage in production with strict guardrails and observability.
6 You need to migrate a high-availability service to a new cloud provider. What’s your plan?
- Plan a phased migration starting with infrastructure setup in the new provider.
- Use tools for data replication and live sync. Validate performance and failover readiness before DNS cutover.
- Ensure rollback mechanisms are in place.
- Use blue-green or shadow traffic testing to validate live behavior before the switch.
7 A background job is starving the main thread of resources. How do you diagnose and resolve it?
- Use performance profilers to inspect thread and CPU usage.
- Isolate the background job to a separate process or thread pool.
- Throttle its execution or reduce its priority.
- Optimize its resource consumption to prevent interference with critical user-facing processes.
8 Your system is slow under load, but resource metrics look fine. What’s your next move?
- Investigate lock contention, thread starvation, or database queuing using profiling tools.
- Use APM to trace slow transactions and measure application-level bottlenecks.
- Consider synthetic load tests to simulate real traffic and identify bottlenecks not visible via CPU or memory metrics.
9 Your application caches are not invalidating properly. How do you handle cache staleness?
- Check if the cache keys and TTLs are correctly defined.
- Use cache versioning or add event-based invalidation via message queues.
- Monitor cache hit/miss ratio and design fallbacks for stale data scenarios.
- Use distributed cache tools that support advanced eviction strategies.
10 Monitoring, Observability & Automation
1 Your alerts are not capturing a slow memory leak that causes a crash after days of uptime. How do you refine observability?
- Introduce trend-based alerting by analyzing memory usage over long time windows.
- Increase metric collection granularity. Capture heap snapshots and perform differential
- analysis. Consider integrating continuous profiling tools to detect leaks early.
2 You need to create SLOs for a service with varying usage patterns. How do you define them?
- Segment the user base or request types and define custom SLOs for each segment.
- Use percentile-based metrics like p95/p99 latency.
- Calculate error budgets aligned with business priorities.
- Regularly revisit SLOs based on evolving usage patterns
3 A team reports inconsistent metrics between dashboards. How do you validate data sources?
- Audit the data collection agents, aggregation intervals, and label configurations.
- Verify if the dashboards use the same queries and time windows.
- Compare metrics directly from source (e.g., Prometheus) to rule out UI-related issues.