2 Monitoring Microsoft Azure Resources and Workloads
2 Azure Monitoring Fundamentals
1-1 Collecting Data with Azure Monitor
Here's a concise summary of the Azure Monitor data collection article:
- Diverse Data Sources: Azure Monitor collects data from numerous sources including:
- Azure resources (VMs, SQL DB, networks, etc.)
- Applications (custom apps, OS info from VMs)
- Azure Subscription (health/availability)
- Azure Tenant (e.g., Microsoft Entra ID)
- Hybrid environments (e.g., on-prem SQL with Azure agents)
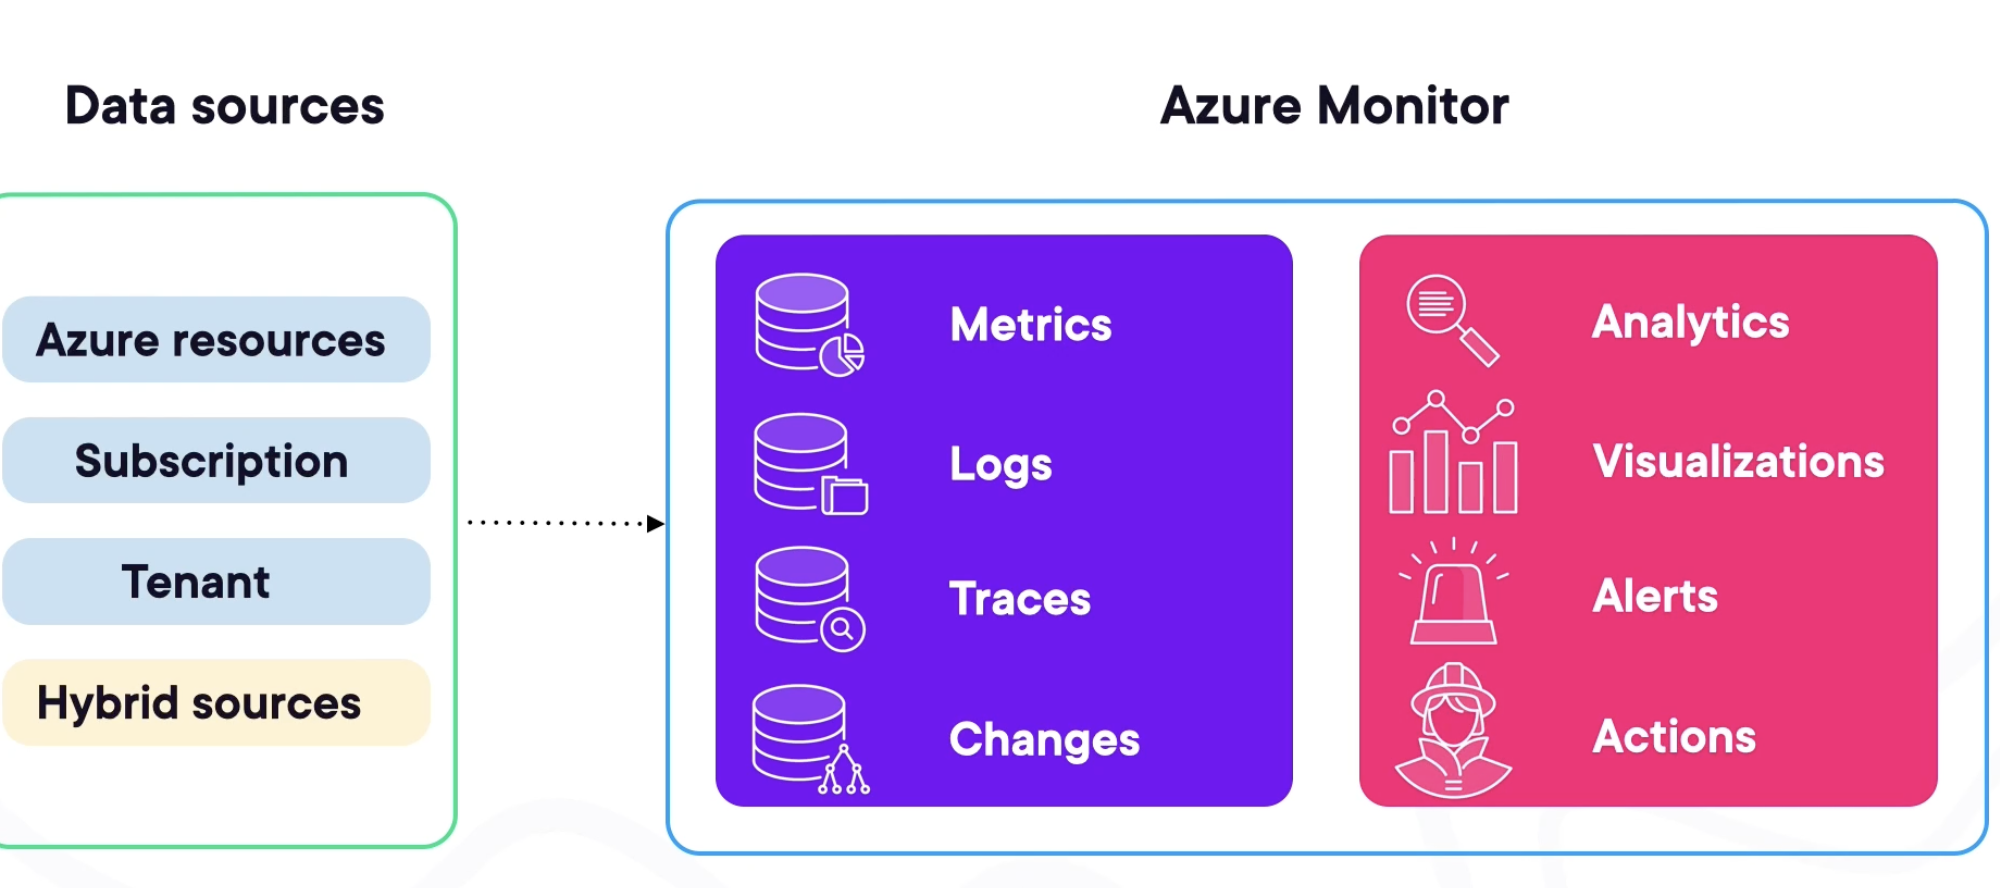
- Primary Data Types:
- Metrics: Numerical time-series data for real-time/short-term performance monitoring (e.g., CPU%, disk I/O, memory pressure).
- Logs: Detailed event/activity records (e.g., security logs, application logs, Windows/Linux system logs, resource state changes).
- Traces: Data for tracking request flows in distributed applications (e.g., via Application Insights).
- Changes: Tracks modifications to Azure resources over time.
Focus: The article (and course) emphasizes Metrics (real-time performance) and Logs (detailed troubleshooting) as the most common and impactful data types.
- Enabling Collection:
- Automatic: Basic data collection starts immediately when an Azure resource is created.
- Enhanced Setup: Requires configuration for deeper insights:
- Enable diagnostic logging on resources (e.g., Azure SQL DB).
- Install Azure Monitor agents on VMs.
- Use the Data Collector API to send data from custom applications (web apps, functions, mobile apps).
1-2 Taking Action on Azure Monitor Data
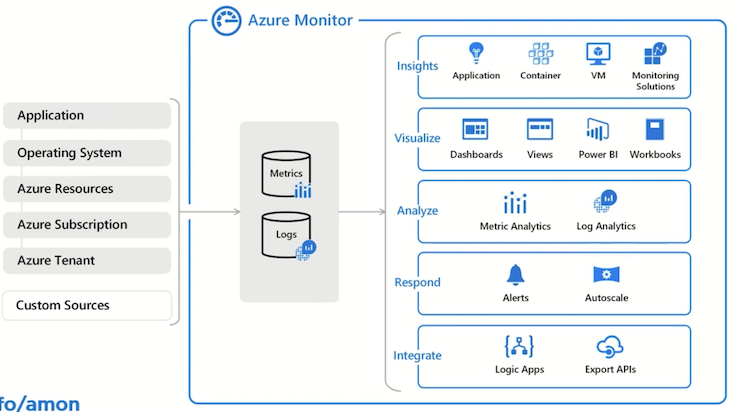
1. Data Analysis Tools
- Metrics Explorer: Visualizes real-time numerical data (CPU%, memory, disk I/O) via charts to track performance trends and set threshold-based alerts.
- Log Analytics: Performs deep investigation using Kusto Query Language (KQL) or a point-and-click interface. Combines logs (Windows events, Linux syslogs, errors) for troubleshooting complex issues.
- Key Difference:
- Metrics: Real-time resource health (automatic collection).
- Logs: Detailed event analysis (may require setup like Log Analytics workspace).
Analytics
Metrics Explorer: Create charts, analyze trends, and identify fluctuations in metric values
Log Analytics: Detailed log investigation and custom queries for in-depth troubleshooting
Analytics Use Cases
Metrics Explorer
- Real-time performance monitoring
- Metrics like CPU, memory, disk
- Threshold-based alerts
- Quick visual overview
- Immediately collected
Log Analytics
- Deep analysis
- Multiple log types and sources
- Tracking event or error patterns
- Powerful KQL queries
- Requires steps to enable
2. Visualization Options
-
Dashboards: Static, high-level view of multiple resources in one place
- Static views in Azure portal showing metrics, logs, or insights. Ideal for quick team sharing.
-
Workbooks: A flexible tool for dynamically interacting with data
- Interactive reports combining multiple datasets for real-time analysis and deep troubleshooting.
-
Power BI: Business analytics service for advanced reporting
- Advanced business reporting (e.g., executive dashboards), integrates external data, and automates updates.
-
Grafana: Open-source dashboard platform
- Open-source dashboards for multi-cloud monitoring (AWS/GCP) and third-party tools (Dynatrace, New Relic).
Analytics Use Cases
- Dashboards: View real-time resource health in the Azure portal
- Workbooks: Investigate performance trends and troubleshoot issues
- Power BI: Executive reports or sharing business insights outside Azure
- Grafana Unified monitoring across cloud platforms and external tool
3. Automated Actions & Alerts
- Alerts: Trigger notifications (email/SMS/webhooks) based on metric thresholds or log patterns.
- Autoscaling: Dynamically adjusts resources (e.g., VMs) to optimize performance/cost.
- AIOps: Automates anomaly detection and issue resolution.
- Insights: Microsoft’s pre-built monitoring experiences for key services (e.g., VMs, containers, networks).
Key Takeaways
- Act on Data: Tools transform raw data into actionable insights (e.g., autoscaling from CPU metrics).
- Visualization Fit:
- Dashboards → Quick health checks
- Workbooks → Interactive analysis
- Power BI/Grafana → Cross-platform or executive reporting
- Automation: Alerts and AIOps enable proactive responses to issues.
- Start with Insights: Microsoft-curated templates accelerate monitoring setup.
💡 Core Value: Azure Monitor closes the loop from data collection → analysis → visualization → automated action.
1-4 Demo: Configuring Alerts and Notifications
🔔 Alert Creation Methods
- Portal Setup (GUI):
- Created Action Group (
pstestgroup) with email notifications. - Defined an alert rule (
Cpu80Percent) for a VM (pstest1):- Condition:
Max CPU > 80%over 1 minute. - Severity: Warning.
- Condition:
-
Enabled email notifications via the action group.
-
CLI Method (Azure Cloud Shell):
- Used
az monitor metrics alert createto create an alert for another VM (pstest2):- Condition:
CPU > 40%. - Severity: Informational (level 3).
- Condition:
az monitor metrics alert create -n "Cpu40Percent" --resource-group "1-b4e6871e-playground-sandbox" --scopes $VMID --condition
"max percentage CPU > 40" --description "Virtual machine is running at or greater than 40% CPU utilization" --evaluation-frequency 1m —-window-size 1m -- severity 3
⚡ Alert Verification
- Ran a load-generation script to trigger alerts.
- Results:
- Both alerts fired:
CPU > 40%(pstest2) andCPU > 80%(pstest1). - Email received for the 80% alert (configured via action group).
- Incident details showed:
- CPU progression graphs.
- Options to update incident status (New/Acknowledged/Closed).
Demo: Analyzing with Azure Monitor Logs 💡 Key Takeaways
- Action Groups: Centralize notifications (email/SMS) for reuse across alerts.
- Flexible Configuration: Use GUI (portal) for one-off setups or CLI (
az) for automation/scaling. - Real-Time Response: Alerts provide:
- Immediate visibility into thresholds (e.g., CPU spikes).
- Contextual data for troubleshooting.
- Notifications to streamline team response.
1-5 Demo: Analyzing with Azure Monitor Logs
Here's a concise summary of the Azure Monitor Logs analysis demo:
🔍 Three Approaches to Log Analysis
-
Pre-Built Queries (Zero-Code):
-
Accessed via Queries Hub (scoped to resources like VMs).
- Example: "Heartbeat" query to verify VM connectivity (
pstest1,pstest2). -
Instantly shows key details: computer name, IP, last check-in time.
-
Simple Mode (Point-and-Click GUI):
- Visually build queries using filters:
- Start with table (e.g.,
Eventfor Windows logs). - Add filters:
Source → EventLog→ Specific computer (e.g.,pstest1).
- Start with table (e.g.,
-
No KQL knowledge needed – ideal for quick ad-hoc analysis.
-
KQL Mode (Advanced Custom Queries):
-
Write Kusto Query Language scripts for deep investigation.
- Example query:
kql Event | where EventLog == "Security" | where EventID == 4625 - Use Case: Track failed logins (
EventID 4625) across all VMs, revealing details like attacker account names (e.g.,fakeuser2).
💡 Key Workflow Insights
- Scope First: Start by selecting a resource group/VM to target analysis.
- Progress from Simple → Advanced:
- Pre-built queries → GUI filtering → Custom KQL.
- KQL Advantages:
- SQL-like syntax (familiar for many users).
- Enables complex cross-VM correlation (e.g., security threat hunting).
- Unified Interface: All approaches accessible in the same Log Analytics workspace.
🚀 Getting Started Tips
- New Users: Leverage pre-built queries + Simple mode to avoid syntax barriers.
- Security/Admin Teams: Use KQL to audit events (e.g., failed logins, resource access).
- Troubleshooting: Combine log types (application/security/system) for root-cause analysis.
Demo Outcome: From verifying VM health to investigating security events, Azure Monitor Logs adapts to user expertise—delivering value immediately. 🕵️♂️
2 Monitoring Microsoft Azure Resources and Workloads
2-1 Introducing Azure Diagnostics Monitoring
Here's a concise summary of the Azure diagnostics monitoring concepts:
⚕️ Service Health & Resource Health
- Purpose: Personalized view of Azure platform issues affecting your resources (e.g., Microsoft-side outages).
- Key Features:
- World map showing regional service status.
- Historical issue tracking (resolved incidents).
- Determines if problems are Azure-related (vs. your configuration).
- Use Case: "Sanity check" before troubleshooting internal issues.
📊 Two Core Monitoring Streams
-
Metrics
-
What: Numerical time-series data (sampled periodically).
- Examples:
- Infrastructure: VM CPU%, disk space, network I/O.
- Apps: HTTP errors, request rates.
-
Analysis Tools: Metrics Explorer, dashboards, alerts.
-
Logs
-
What: Event-based records (discrete occurrences).
- Types:
- Activity Log: Subscription-level control-plane audits (e.g., "VM deleted").
- Diagnostic Logs: Resource-level data-plane events (e.g., VM guest OS logs).
- Storage:
- Metrics → Tables
- Logs → Blobs (e.g., IIS logs) or Log Analytics.
- Analysis Tools: Log Analytics, KQL queries.
⚙️ Enabling Diagnostics
- Data Capture: Send both metrics and logs to:
- Azure Storage (tables/blobs).
- Log Analytics workspace.
- Event Hubs (streaming).
- Guest OS Monitoring: Enable for VMs to collect:
- Performance counters (CPU/memory).
- IIS/application logs.
- System event logs.
🎯 Monitoring Goals
- Break/Fix: Rapid incident response.
- Optimization: Performance tuning (e.g., scaling based on trends).
- Security: Detect anomalies/breaches.
- Proactive Management: Address issues before they impact users.
Key Insight: Azure diagnostics provide critical visibility despite no physical access to datacenters. Start by defining why you need monitoring (e.g., SLA compliance, cost control).
2-2 Enabling Azure Diagnostics Monitoring
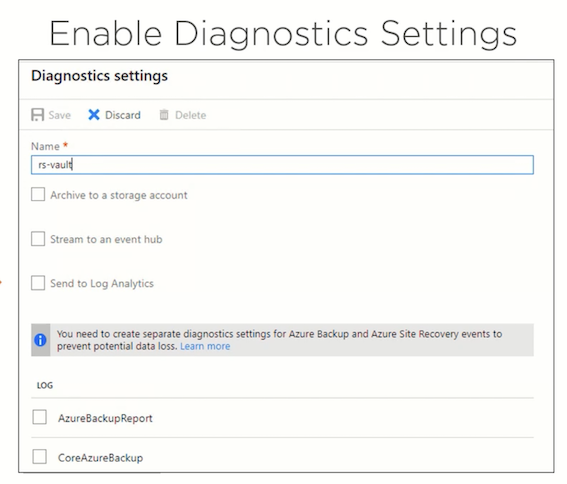
Here's a concise summary of the Azure diagnostic settings configuration:
⚙️ Key Configuration Features
-
Flexible Setup
-
Create multiple diagnostic settings per resource.
- Configure most resources directly in Azure Monitor (except VM guest OS diagnostics, set at VM scope).
📤 Three Output Destinations
| Destination | Use Case |
|---|---|
| Storage Account | Long-term archival of raw logs/metrics (blobs/tables). |
| Event Hub | Real-time event streaming (handles millions of events); enables downstream processing (e.g., alerts, custom analytics). |
| Log Analytics | Advanced querying/analysis with KQL (Microsoft's recommended standard). |
💡 Critical Note: Outputs are not mutually exclusive – send data to multiple destinations simultaneously.
📊 Data Collection Options
-
Varies by Resource Type:
-
Some resources offer both logs + metrics (e.g., Azure SQL DB).
-
Others provide only metrics (e.g., Azure Load Balancer) or only logs (e.g., Azure Policy).
-
Selectable Categories: Choose specific log types/metrics to collect (e.g., audit logs, performance counters).
💡 Key Takeaway
Azure diagnostic settings offer centralized, customizable pipelines to route monitoring data where it’s needed – whether for compliance (storage), real-time ops (Event Hubs), or deep analysis (Log Analytics). Always verify supported data types per resource.
2-3 Azure Monitor Data Sources
Here's a concise summary of Azure Monitor's data layers and capabilities:
⚙️ Three Layers of Metrics Collection
Azure Monitor Metrics Data Sources
Platform metrics / Guest OS metrics / Application metrics / Custom metrics
-
Platform Metrics
-
Automatically collected baseline metrics (e.g., VM CPU%, network I/O).
-
Requires no configuration – available out-of-the-box.
-
Guest OS Metrics
-
Enriched via agents (Windows/Linux VMs):
- Performance counters (Windows)
- Syslogs (Linux)
- Windows Event Logs
-
Application Metrics
-
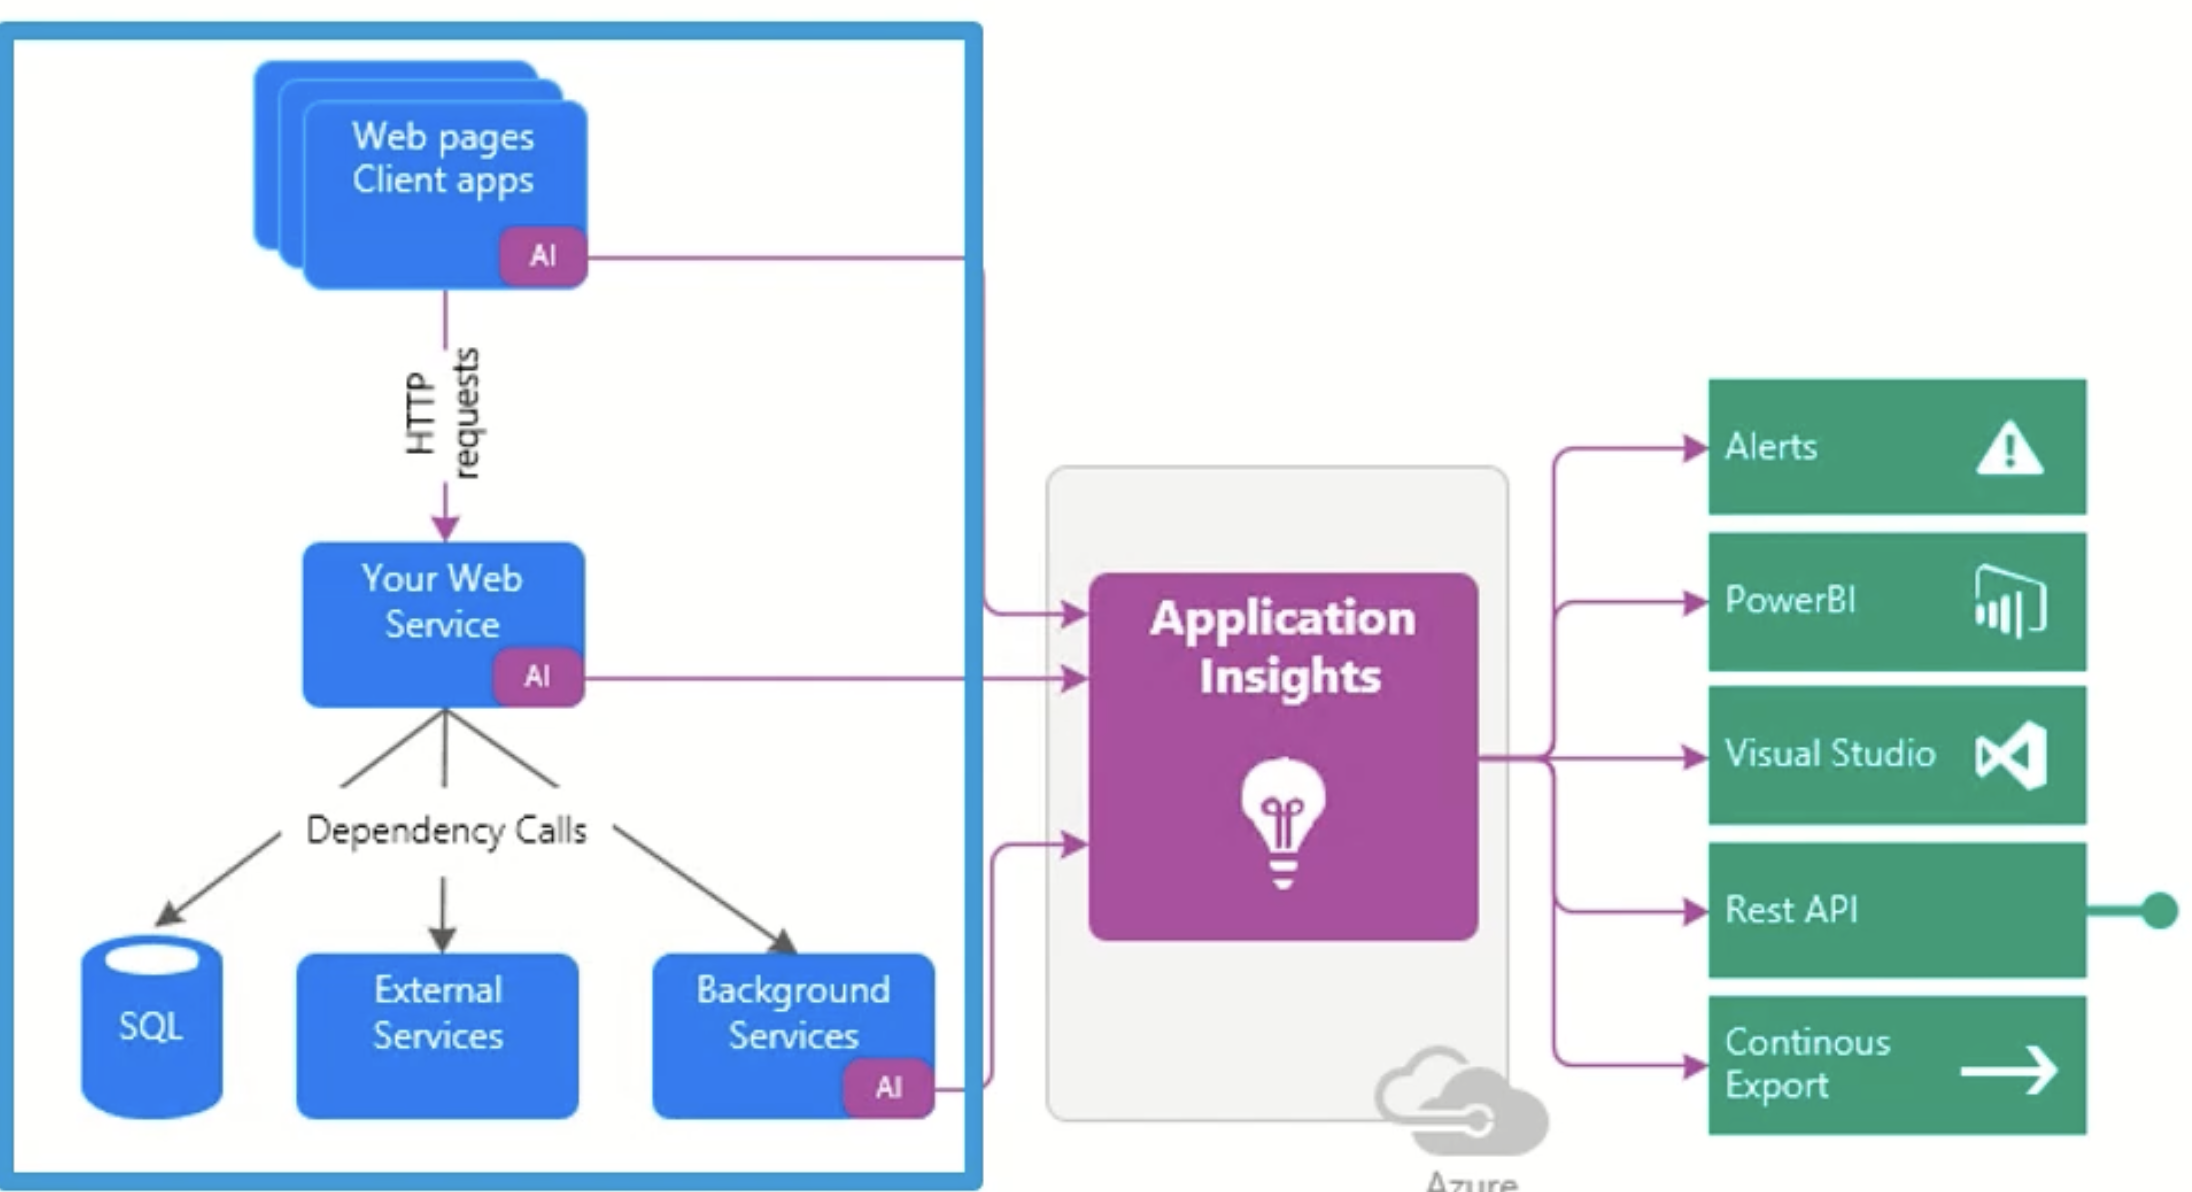
Via Application Insights (APM):
- HTTP requests, dependencies, performance issues
-
Custom metrics from application code
-
Custom metrics
| Tool | Purpose | Key Features |
|---|---|---|
| Metrics Explorer | Visualize platform/guest metrics | Multi-resource charts, baselining, alert creation |
| Log Analytics | Unify & analyze logs across resources | Kusto Query Language (KQL), normalized data tables |
| Application Insights | Monitor app performance (PaaS/IaaS) | End-to-end transaction tracing, instrumentation |
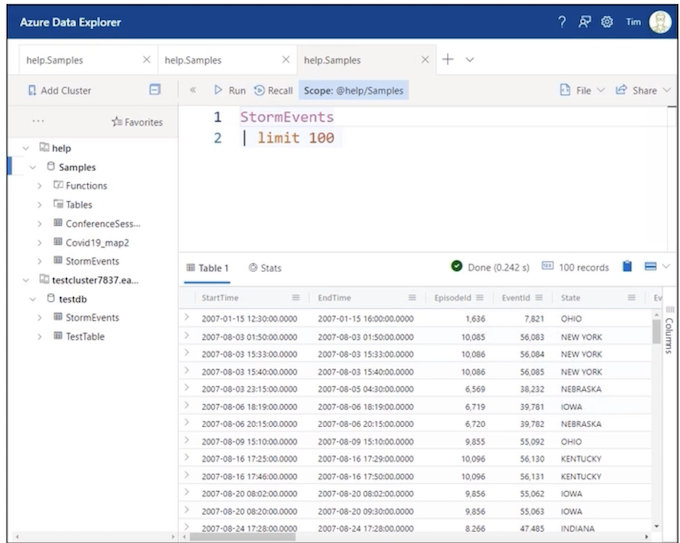
🔍 Log Analytics Backend: Built on Azure Data Explorer (ADE) – a scalable engine for log normalization/querying.
Monitor Log Data
Disparate data sources Log formats / VMs / Storage accounts
Azure Data Explorer
- Fast, highly scalable data exploration service
- Normalized data warehouse
- Kusto Query Language (KQL)
Log Analytics
- Based on ADE
- On-board VMs, storage accounts, diagnostic settings
App Insights
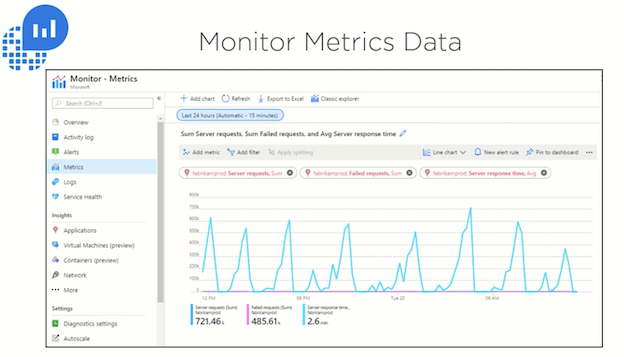
📈 Baselining & Proactive Monitoring
- Purpose: Establish performance norms to detect anomalies.
-
Workflow:
-
Collect continuous metrics/logs
- Define "normal" operational parameters (e.g., peak/valley trends)
- **Alert on deviations **
-
Trigger automated actions (e.g., scaling, notifications)
-
Critical Tip: Avoid over-instrumentation – start with critical baselines.
🔑 Key Distinctions
-
Log Analytics vs. Application Insights:
-
Log Analytics: Aggregates infrastructure/OS logs.
-
App Insights: Tracks application-layer performance (code-level).
-
KQL (Kusto Query Language): SQL-like syntax for cross-resource log queries.
💡 Pro Tip: Use Metrics Explorer for real-time resource health dashboards and Log Analytics/KQL for deep forensic analysis.
2-6 Demo: Configure Diagnostics Settings
⚙️ Enabling Diagnostics
-
Resource-Level Setup
-
Most Resources: Configure via Azure Monitor → Diagnostics settings
- Example: Network interface (
vm2-nic) enabled with: - Archival to storage account (
Contosodiag1) - Streaming to Event Hub (
pshub704/diagnostics) - Optional Log Analytics integration
- Resource Variations:
- Network interfaces → Metrics only
- NSGs → Logs only (network events/rule counters)
- Example: Network interface (
-
Virtual Machines (Special Case)
-
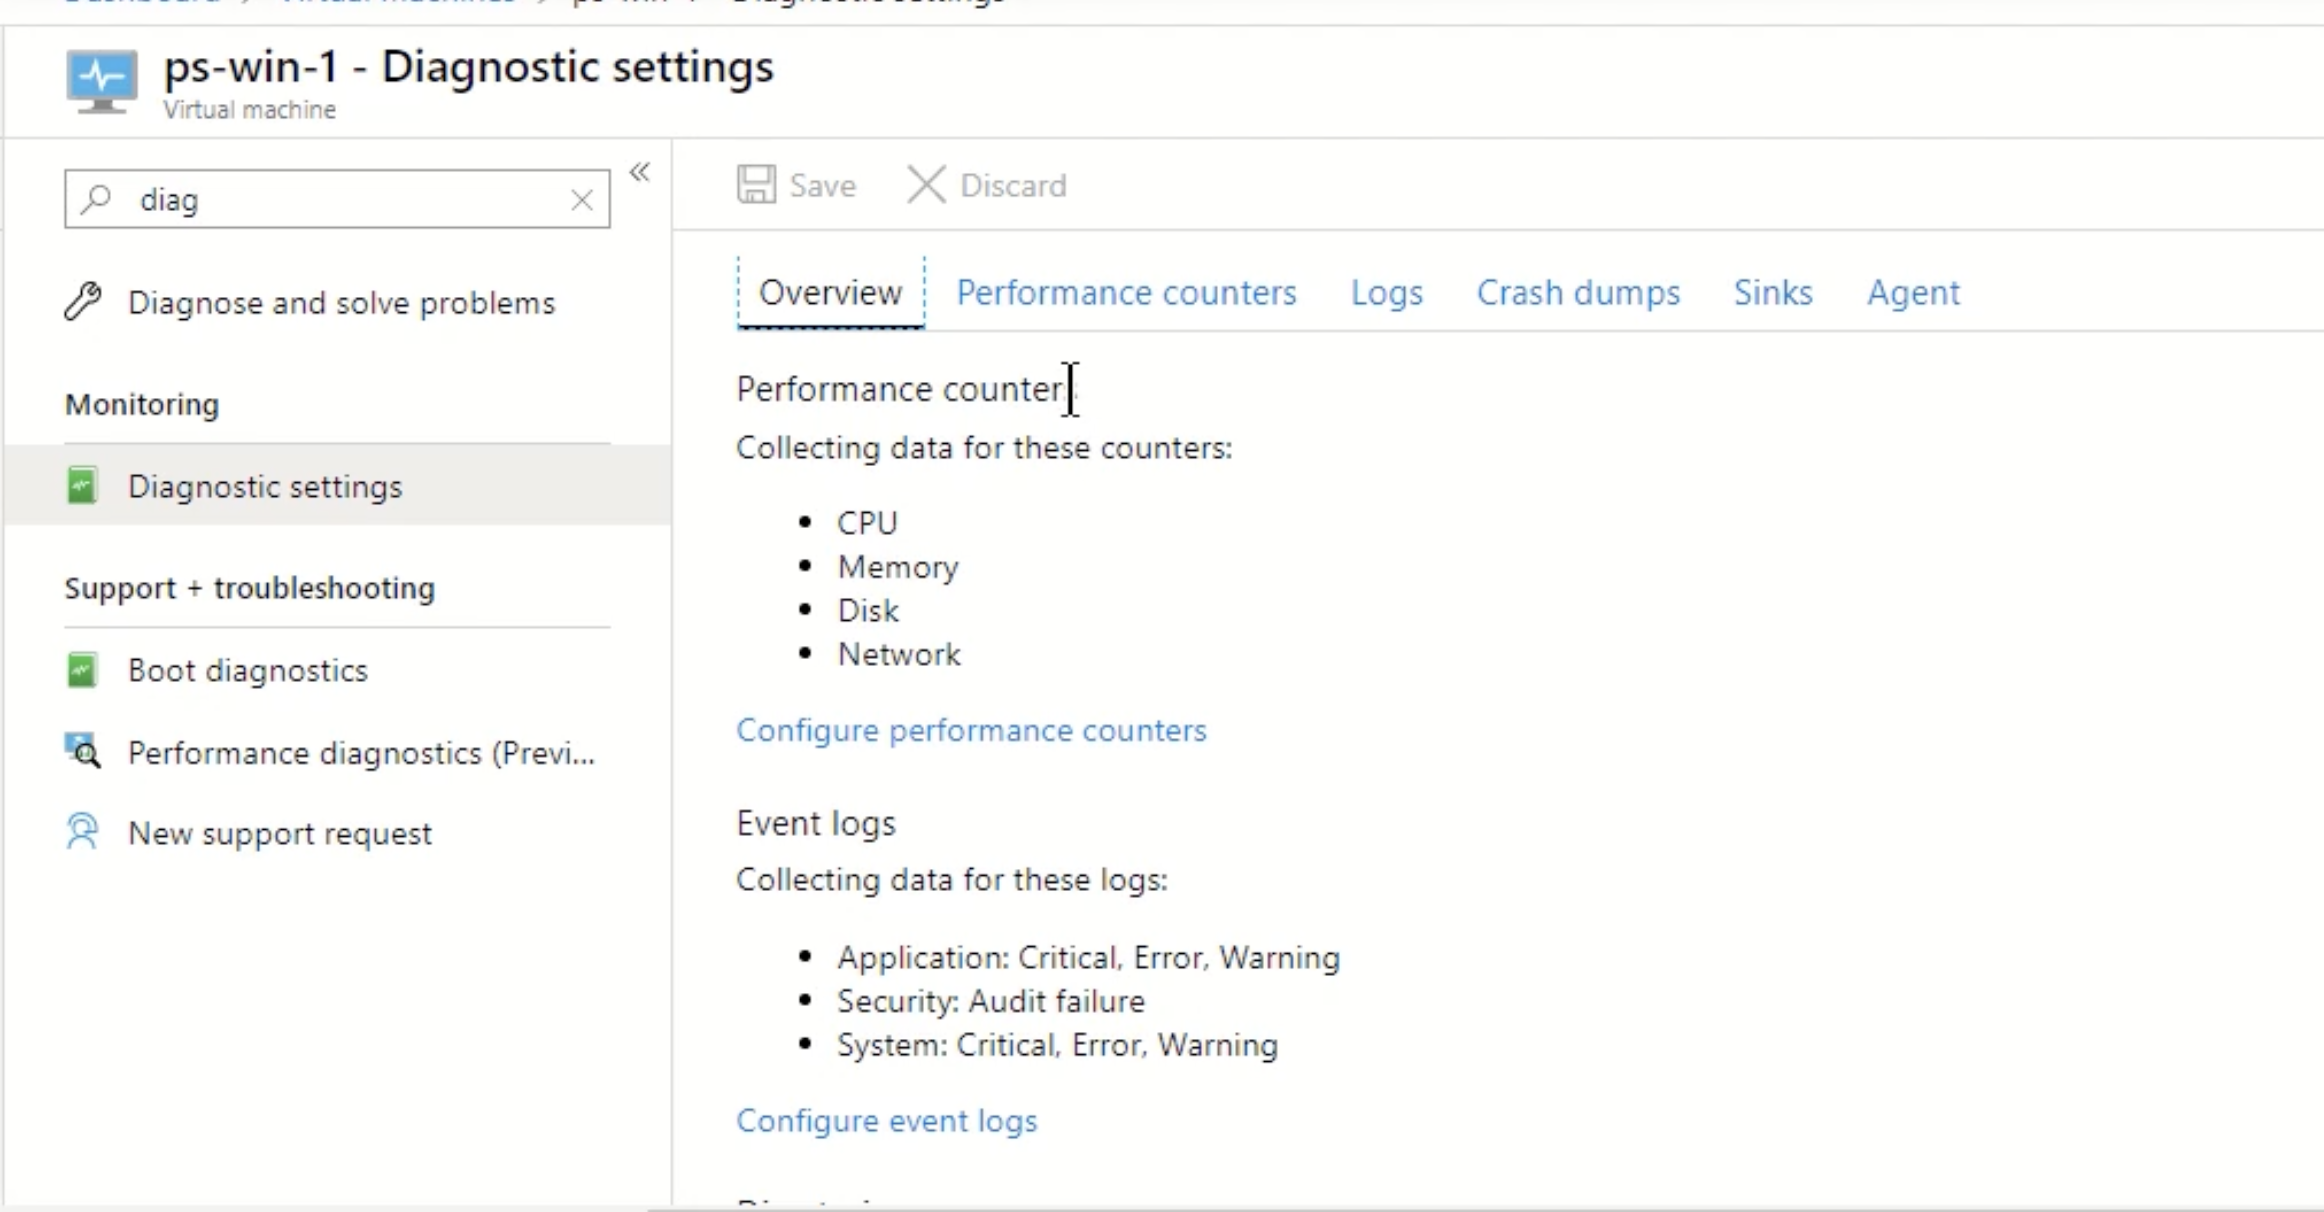
Enabled via VM blade → Diagnostics settings
- Installs Azure Diagnostics Extension (Windows/Linux):
- Windows: Performance counters, Event Logs, IIS logs
- Linux: Syslog, disk/CPU/memory metrics
- Requires running VM state for configuration
- Storage account mandatory for data retention
📊 Metrics Explorer Demo
- Plotting Metrics
- Scope: Select VM resource (
vm1) - Metric:
Percentage CPU(host-level) -
Customization:
- Aggregation (Avg/Min/Max)
- Time range (default 24h → adjustable)
- Chart types (line/bar/area)
-
Persistence Options
- Pin to dashboard: Real-time monitoring
- Copy link: Save chart configuration (avoids recreation)
💡 Key Insights
- Automatic Baseline Metrics: Collected for all resources (even without diagnostics)
- Agent-Dependent Data: Richer metrics (e.g., guest OS) require extension installation
- Resource Differences:
- VMs need per-instance configuration
- Non-VM resources use centralized Monitor settings
- Pro Tip: Use Chart Link Sharing to preserve complex metric views
Demo Workflow: Enabled diagnostics → Customized VM metrics → Visualized CPU usage → Saved chart for reuse.
2-7 Azure Monitor Log Search
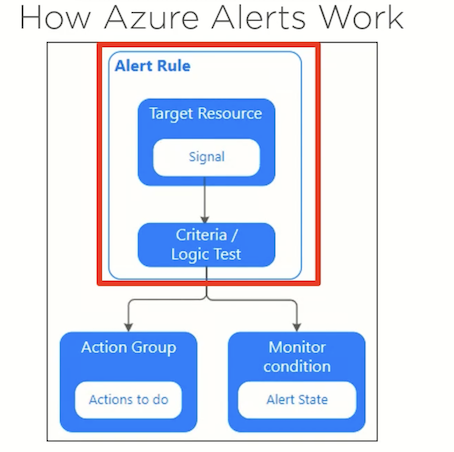
⚡ Alert Rule Components
- Target Resources
- Monitored Azure resources (e.g., VMs, databases)
- Signals
- Trigger events (e.g., VM restart, CPU threshold breach)
- Logic/Condition
- Boolean criteria defining when to fire (e.g., "CPU > 80% for 5 minutes")
🛠️ Action Groups
- Reusable workflows triggered by alerts
- Actions beyond notifications:
- Run scripts (PowerShell/Python/C#) for auto-remediation (e.g., restart VM)
- Integrate with ITSM tools (ServiceNow, Jira)
- Notify via email/SMS/push/voice
- Trigger Azure Functions or Logic Apps
📊 Monitoring & Auditing
- Track alert states (fired/resolved)
- Audit trails for all actions
- Historical incident analysis
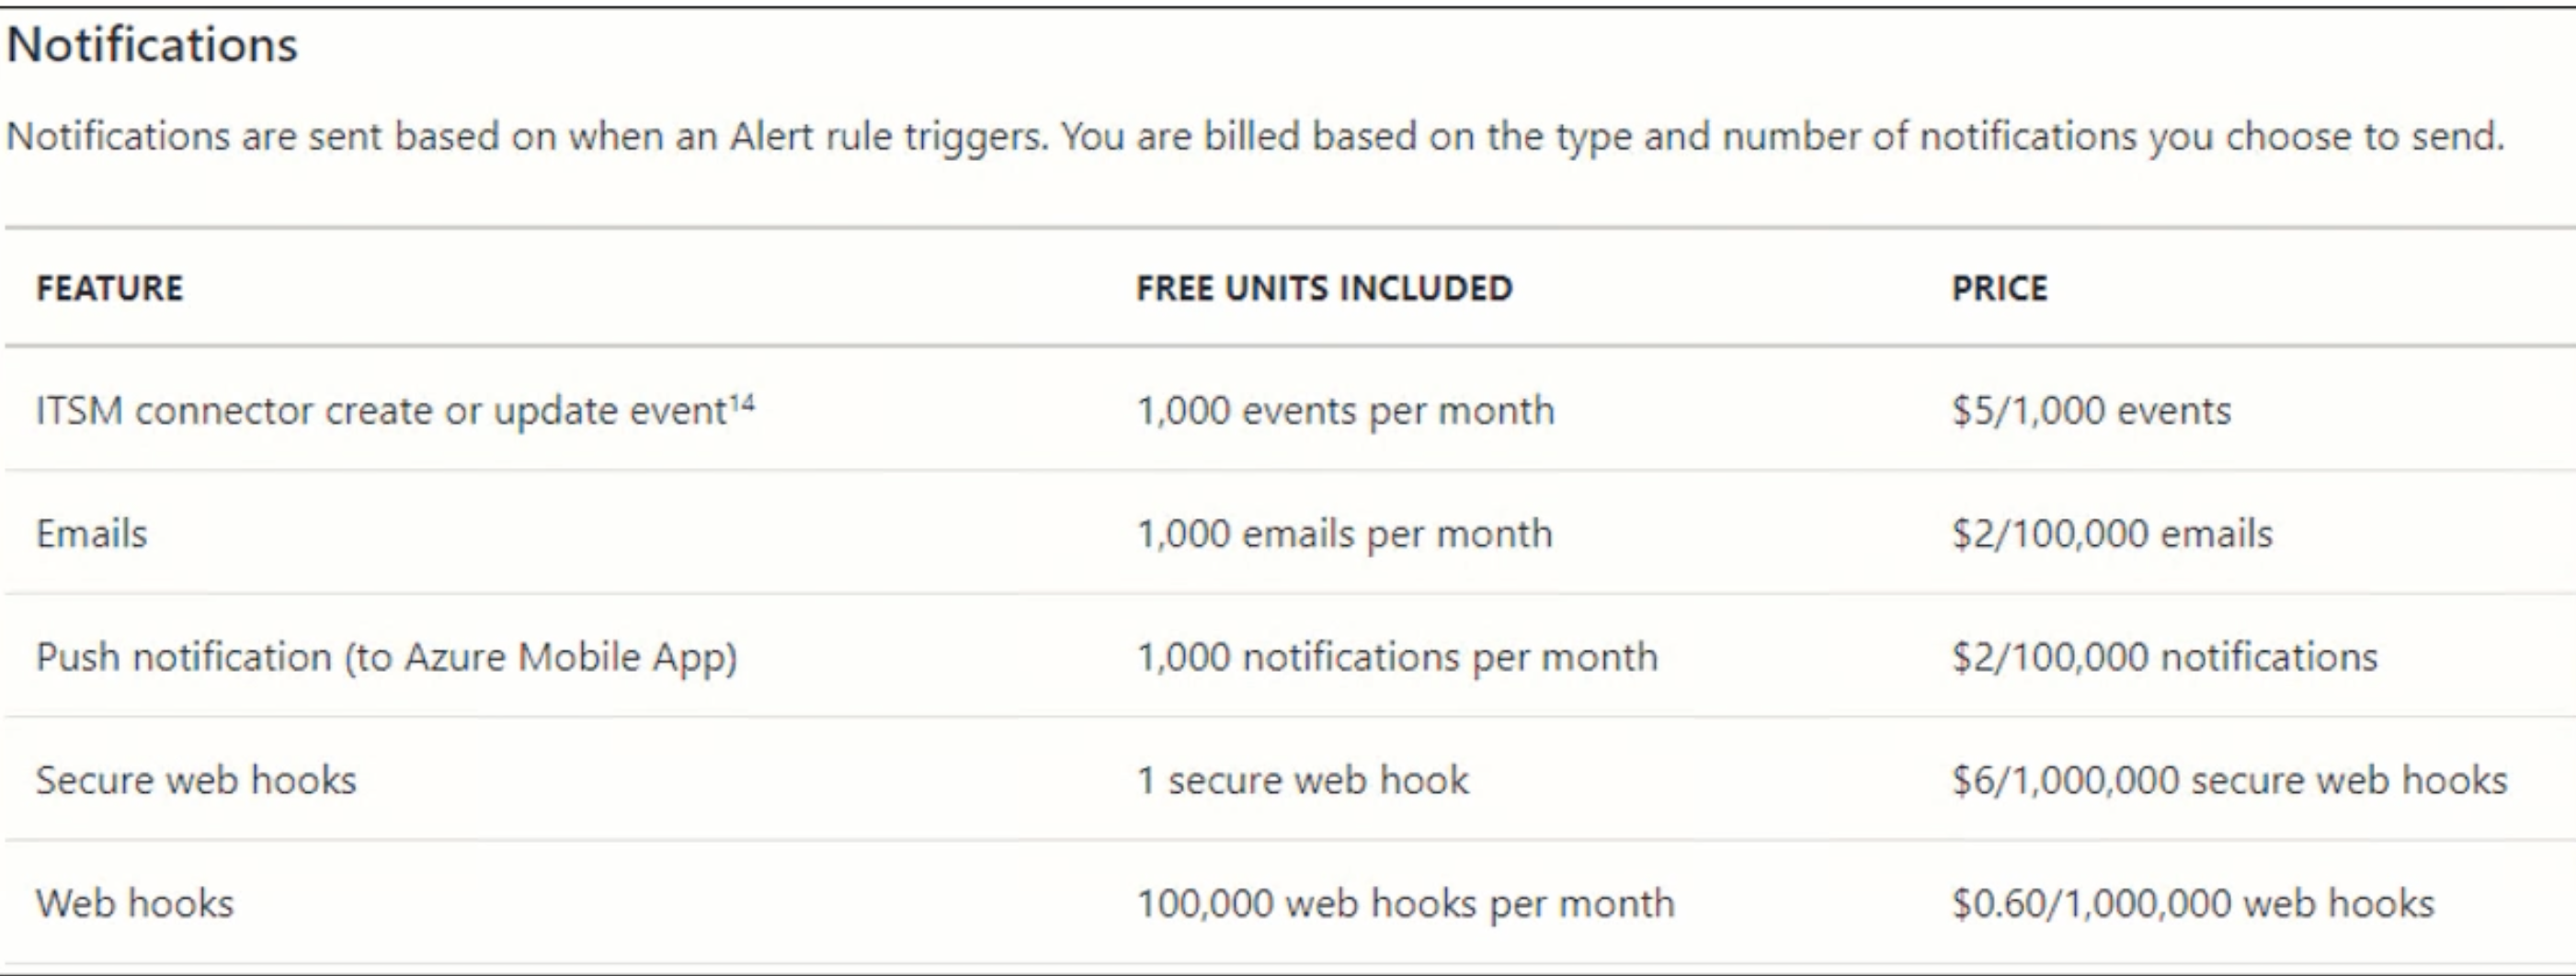
💰 Pricing
- Free tier:
- 1,000 email/push notifications monthly
- Beyond free tier:
- Low-cost per notification (check Azure Alerts Pricing)
💡 Key Value
- Proactive ops: Transform monitoring → automated response
- Unified platform: No need for custom notification systems
- Scalable: Handles enterprise workloads with pay-as-you-go model
Example: Auto-restart VMs when shutdowns occur, with audit logs and SMS alerts.
2-8 Azure Monitor Log Search
Here's a concise summary of Azure Monitor Log Analytics capabilities:
📊 Core Functionality
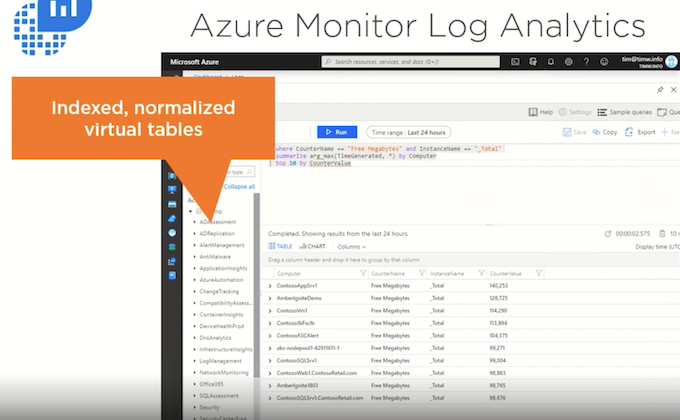
- Workspace Architecture
- Central Log Analytics workspace aggregates logs from all onboarded resources
-
Data automatically normalized/indexed into virtual tables with unified schema
-
Kusto Query Language (KQL)
- SQL-like syntax with Splunk/PowerShell similarities
- Dynamic query editor in Azure portal with live visualization toggle (tables ↔ charts)
🚀 Key Features
- Export & Integration
- Save/share queries across teams
- Export to CSV/Power BI for dashboards
- Trigger alerts from query results
- Pre-Built Solutions
- Azure Marketplace solutions (e.g., Activity Log Analytics)
- Centralized views across subscriptions
- Ready-made dashboards/visualizations
🔍 Activity Log Analytics Example
- Purpose: Unified control-plane auditing ("who did what when")
- Capabilities:
- Aggregate admin logs across multiple subscriptions
- Run cross-subscription KQL queries
- Pre-configured dashboards for access/change analysis
💡 Critical Value Propositions
- Schema Normalization
- Transforms disparate log formats into query-friendly tables
- Unified Operations
- Single pane for infrastructure/app/audit logs
- Extensible Ecosystem
- Marketplace solutions accelerate monitoring setup
- Proactive Alerting
- Convert log patterns into actionable triggers
Example Workflow: Onboard VMs → Query failed logins (KQL) → Visualize attack patterns → Automate security alerts.
2-9 Demo: Perform Log Searches
🛠️ Workspace Setup & Configuration
- Create Workspace:
- Foundation for log aggregation (e.g.,
ps-workspace). - Onboard Data Sources:
- Connect VMs, storage accounts, activity logs via Diagnostic Settings.
- Key constraint: A VM can link to only one workspace at a time.
- Install Log Analytics Agent:
- Automatically deployed when connecting VMs → streams OS/resource data to workspace.
🔌 Extending Capabilities with Solutions
- Azure Marketplace Solutions:
- Pre-built tools (e.g.,
AzureBackup,NetworkMonitoring) add specialized dashboards/queries. - Install via Solutions blade → enhances workspace functionality.
- Note: Each solution has its own pricing (check exercise files).
🔍 Querying with KQL (Kusto Query Language)
- Access Interfaces:
- Azure Portal: Built-in Logs interface.
- Query Playground: Microsoft-hosted sandbox (authenticate via Azure AD).
- Key Features:
- IntelliSense: Auto-complete for tables/commands (e.g.,
Perf,SecurityEvent). - Cross-Table Queries: Join data from multiple sources (e.g.,
search SecurityEvent | where ...). - Time Filters: Use
ago()for dynamic time ranges (e.g.,where TimeGenerated > ago(1h)). - Query Examples:
kql
   Perf | where TimeGenerated > ago(24h) | summarize count() by ObjectName, CounterName
kql SecurityEvent | where EventID == 4625 // Failed logins
search in (SecurityEvent) "Cryptographic"
take 10

Perf |
where TimeGenerated > ago (1h)
summarize count() by ObjectName, CounterName

// comments

SecurityEvent
| where Level == 8
| where EventID == 4672
Event
| where EventLog == "Application"
| where TimeGenerated > ago (24h)
| where RenderedDescription contains "cryptographic"
📊 Visualization & Export
- Dynamic Toggling: Switch between table/chart views based on query results.
- Export Options:
- CSV: For offline analysis.
- Power BI: Build live dashboards.
- Alerts: Trigger rules from query results.
- Saving/Sharing: Reuse queries across teams.
💡 Pro Tips
- Use Sample Queries: Built-in templates (e.g., "Computer performance") jumpstart analysis.
- Leverage Schema Pane: Explore tables/columns under LogManagement.
- Playground Advantage: Practice KQL safely using Microsoft’s demo data.
Demo Workflow: Created workspace → Onboarded VMs → Installed solutions → Ran KQL queries → Exported to CSV/Power BI.
Next Steps: Deepen KQL skills using exercise files/Pluralsight courses.
3 Monitoring Your Spend in Microsoft Azure
3-1 Get Estimated Azure Costs Pre-deployment
💰 Cost Estimation Tools
- Azure Pricing Calculator
- Web-based tool on azure.com for pre-deployment cost modeling
-
Supports most Azure services (VMs, databases, storage, etc.)
-
In-Portal Estimates
-
Real-time cost displays when configuring resources:
- VM size selection shows monthly estimates
- Azure SQL DB tiers show pricing during setup
-
Programmatic Access
- Consumption API: Track usage expenditures
- Rate Card API: Look up real-time pricing per service/region
🌍 Critical Regional Factors
- Price Variability: Costs differ by region due to:
- Local energy/operational expenses
- Infrastructure availability
- Service Limitations: Not all services available in every region
- Strategic Impact: Region choice directly affects:
- Deployment costs (e.g., US West vs. Southeast Asia)
- Architecture decisions (e.g., geo-redundancy tradeoffs)
💡 Key Recommendations
- Always Specify Region: Use region filters in pricing tools for accuracy
- Combine Tools: Use calculator for planning + portal for real-time validation
- Monitor Post-Deployment: Pair estimates with Cost Management for ongoing optimization
Example: A D4s v3 VM in East US = ~$299/month vs. West Europe = ~$327/month (illustrates regional variance).
3-2 Get Estimated Azure Costs Pre-deployment
💳 Core Cost Tracking Tools
- Invoices
- Detailed monthly expenditure breakdowns (for PAYG subscriptions).
- Budgets & Alerts
- Set spending limits (critical for Enterprise Agreements).
- Receive notifications at custom thresholds (e.g., 80% of budget consumed).
📊 Deep Cost Analysis
- Azure Cost Analysis Tool:
- Native portal interface for spend exploration.
- Tracks costs by service/resource group/tags.
- Cloudyn Integration:
- Advanced visual dashboards (easier than spreadsheets).
- Optimization Engine:
- Identifies underutilized resources (e.g., "Downsize VM X to save $Y/year").
- Recommends reservations or rightsizing.
⚖️ Cloudyn vs. Azure Advisor
| Feature | Azure Advisor | Cloudyn |
|---|---|---|
| Cost Analysis Depth | Baseline recommendations | Advanced optimization |
| Visualization | Limited | Rich dashboards |
| Use Case | Quick checks | Enterprise cost governance |
💡 Key Takeaways
- Proactive Controls: Budgets/alerts prevent cost overruns.
- Visual Insights: Cloudyn transforms raw data into actionable reports.
- Optimization: Combine Advisor (quick wins) + Cloudyn (deep dives) for maximum savings.
- EA Focus: Budget tracking is essential for credit-based subscriptions.
Example: Cloudyn might flag an underused $500/month VM that could be replaced with a $200/month instance → $3,600/year saved.
3-3 Demo: View Subscription and Cost Data
🔐 Access Control (IAM)
- Billing Permissions:
- Assign
Billing Readerrole for read-only billing access - Initial subscription creator = default billing admin (transferable)
- RBAC Principle: Apply least privilege for cost visibility
💰 Cost Management Tools
- Budgets
- Set spend thresholds (subscription/resource group level)
- Alert triggers via Action Groups (email/SMS)
- Reset periods: Monthly/Quarterly/Yearly
- Invoices
- Download/view PAYG invoices
- Email invoices directly from portal
⚙️ Subscription Administration
- Renaming/Organization: Label subscriptions clearly
- Directory Transfer:
- Move subscription between Azure AD tenants
- Critical note: Doesn’t transfer billing ownership
- Cancellation: Directly from Overview blade
- Resource Providers:
- Register/unregister services (troubleshooting API issues)
🤝 Partner & External Integrations
- Cloud Service Providers: Link partner IDs for usage sharing
- Network Virtual Appliances: View external billing linkages
📊 Key Workflow Highlights
- Budget Creation:
Scope → Amount → Alert conditions → Action group - Invoice Delegation: Use "Access Invoice" to grant billing access
- Directory Change Caveats:
- Original directory can’t be deleted until billing ownership is transferred
- Microsoft Docs for detailed process
Pro Tip: Combine budgets with Azure Monitor alerts for automated cost governance (e.g., auto-shutdown VMs at 90% budget utilization).
💡 Critical Takeaways
- Filter subscriptions to reduce portal clutter
- Budgets = specialized cost alerts (leverages Action Groups)
- Billing access ≠ subscription access (manage via IAM)
- Always verify resource provider registration for new services
- Directory changes require explicit billing ownership transfer
This setup enables granular cost control while maintaining security and operational flexibility.
3-4 Forecast and Optimize Your Azure Spend
⚙️ Cost Optimization via Azure Advisor
- Key Recommendations:
- Resize/Shut Down underutilized VMs
- Delete idle VPN Gateways (high-cost if unused)
- Purchase Reserved VM Instances (save 40-70% vs. pay-as-you-go)
- Clean up orphaned resources: Unattached public IPs, unused disks
- Use Standard-tier snapshots for managed disks (no premium needed for backups)
📈 Forecasting Tools
- Azure Cost Management:
- Built-in portal tool for spend visualization
- Projects future costs based on current usage patterns
-
Breaks down costs by service/resource/region
-
Cloudyn Integration:
-
Advanced forecasting gradually merging into Azure Cost Management
- Provides richer dashboards and long-term trend analysis
💡 Strategic Insights
- Proactive Savings:
- Reservations → Significant long-term discounts
- Resource hygiene → Eliminates "orphaned resource tax"
- Tier Optimization:
- Match storage performance to actual needs (e.g., standard snapshots)
- Continuous Monitoring:
- Combine Advisor recommendations with Cost Management trends
Example Impact:
- Resizing 5 underused VMs: ~$15k/year saved
- Switching to reserved instances: ~60% cost reduction
🔮 Future Outlook
Microsoft is unifying Cloudyn’s depth with native Azure tools – expect:
- Enhanced forecasting algorithms
- Deeper cross-subscription insights
- Automated optimization workflows
Next Step: Implement Advisor recommendations + set budget alerts to lock in savings.
Here's a concise summary of Azure cost management layers and tools:
🔍 Cost Management Hierarchy
- Management Groups
- Organize subscriptions hierarchically (above subscriptions, below Azure AD tenant)
- Enable cross-subscription cost analysis
-
Best Practice: Use even with single subscriptions for future scalability
-
Scope Control
- Toggle between tenant/management group/subscription/resource views
⚙️ Core Tools in Cost Management & Billing
- Azure Advisor (Cost Tab)
-
Free ML-powered optimization:
- Reserved instance recommendations
- Underutilized resource identification
- Orphaned resource cleanup (e.g., unattached IPs)
-
Cost Analysis
- Key Features:
- Views: Accumulated/Daily/Service/Resource costs
- Tag-based grouping: Critical for cross-resource-group tracking
- Export options: PNG/PDF/CSV
-
Time Frames: Customizable (last 7 days, calendar months, etc.)
-
Cloudyn Transition
- Native Azure tools now replace Cloudyn
- New Cloudyn registrations restricted to CSP partners
🏷️ Strategic Importance of Tagging
- Cost Allocation: Track expenses across projects/departments
- Analysis Use Case:
markdown Cost Analysis → Group By → "Tag:ProjectX" - Solves limitation of resource-group-only tracking
📊 Workflow Highlights
- Navigate to:
Cost Management + Billing → Cost Management - Set Scope: Management group / Subscription
- Analyze: Use built-in views or custom tags
- Optimize: Implement Advisor recommendations
- Export: Share reports via PDF/CSV
Pro Tip: Combine daily cost alerts with tag-based dashboards for real-time budget control.
💡 Key Takeaways
- Management Groups > Subscriptions: Foundation for enterprise cost governance
- Tags Are Non-Negotiable: Essential for accurate cost attribution
- Advisor = Free Savings: Automatically identifies waste
- Cloudyn Phase-Out: Prioritize native Azure Cost Management tools
This layered approach enables granular cost tracking from tenant-level down to individual resources.
3-5 Demo: Work with Azure Cost Analysis
🔍 Cost Management Hierarchy
- Management Groups
- Organize subscriptions hierarchically (above subscriptions, below Azure AD tenant)
- Enable cross-subscription cost analysis
-
Best Practice: Use even with single subscriptions for future scalability
-
Scope Control
- Toggle between tenant/management group/subscription/resource views
⚙️ Core Tools in Cost Management & Billing
- Azure Advisor (Cost Tab)
-
Free ML-powered optimization:
- Reserved instance recommendations
- Underutilized resource identification
- Orphaned resource cleanup (e.g., unattached IPs)
-
Cost Analysis
- Key Features:
- Views: Accumulated/Daily/Service/Resource costs
- Tag-based grouping: Critical for cross-resource-group tracking
- Export options: PNG/PDF/CSV
-
Time Frames: Customizable (last 7 days, calendar months, etc.)
-
Cloudyn Transition
- Native Azure tools now replace Cloudyn
- New Cloudyn registrations restricted to CSP partners
🏷️ Strategic Importance of Tagging
- Cost Allocation: Track expenses across projects/departments
- Analysis Use Case:
markdown Cost Analysis → Group By → "Tag:ProjectX" - Solves limitation of resource-group-only tracking
📊 Workflow Highlights
- Navigate to:
Cost Management + Billing → Cost Management - Set Scope: Management group / Subscription
- Analyze: Use built-in views or custom tags
- Optimize: Implement Advisor recommendations
- Export: Share reports via PDF/CSV
Pro Tip: Combine daily cost alerts with tag-based dashboards for real-time budget control.
💡 Key Takeaways
- Management Groups > Subscriptions: Foundation for enterprise cost governance
- Tags Are Non-Negotiable: Essential for accurate cost attribution
- Advisor = Free Savings: Automatically identifies waste
- Cloudyn Phase-Out: Prioritize native Azure Cost Management tools
This layered approach enables granular cost tracking from tenant-level down to individual resources.
4 Microsoft Monitoring Azure Updates
4-1 Azure Cost Management
Here's a concise summary of Azure spend reporting in Cost Management:
📊 Core Reporting Tools
- Cost Analysis Hub
- Views:
- Accumulated spend
- Forecasted future costs
- Breakdowns by service/location/resource
- Forecasting: Predicts month-end spend based on current trends
🏷️ Critical Features
- Tag Filtering:
- Track costs across resource groups/subscriptions
- Essential for multi-department/project cost allocation
- Export & Sharing:
- Generate CSV reports
- Share custom views with stakeholders
- Alerts Integration:
- Trigger notifications at spending thresholds
⚠️ Cloudyn Transition
- Deprecation Status:
- Cloudyn (acquired by Microsoft) is being phased out
- Functionality now natively integrated into Azure Cost Management
- Action: Use built-in tools instead of standalone Cloudyn
⚙️ Workflow Summary
graph TD
A[Access Cost Analysis] --> B{Configure View}
B --> C[Scope: Subscription/Resource Group]
B --> D[Filter: Tags/Service/Location]
B --> E[Select: Forecast/Accumulated View]
C --> F[Export CSV/Share Dashboard]
D --> G[Identify Cost Centers]
E --> H[Track Against Budgets]
💡 Key Takeaways
- Forecasting > Retrospection: Proactively manage budgets using prediction tools
- Tag Discipline: Implement consistent tagging for accurate cost attribution
- Native Over Third-Party: Rely on Azure's built-in cost tools (Cloudyn replacement)
- Actionable Outputs: Export data for finance teams/audits
Pro Tip: Combine daily cost alerts with tag-based dashboards for real-time budget control across projects.
Next Step: Set up monthly forecast vs. actual reports using exported CSV data.
4-2 Azure Monitor Workbooks
📘 Azure Monitor Workbooks
- Purpose:
- Solves "metric overload" by providing curated monitoring views
- Combines metrics, KQL queries, and markdown in interactive reports
- Key Features:
- Predefined templates for common scenarios (e.g., VM performance, app health)
- Custom report creation with drag-and-drop components
- Real-time collaboration for teams
- Value:
- Replaces manual Metric Explorer configuration
- Contextualizes data (e.g., explanations + visuals + live queries)
⚖️ Workbooks vs. Notebooks
| Feature | Azure Monitor Workbooks | Azure Notebooks |
|---|---|---|
| Core Function | Monitoring dashboards | Code execution + data science |
| Technology | Native Azure tool | Hosted Jupyter Notebooks |
| Components | Metrics + KQL + markdown | Markdown + executable code (Python/R) |
| Primary Users | DevOps/IT Ops | Data scientists/ML engineers |
| Hosting | Integrated in Azure Monitor | notebooks.azure.com |
💡 Key Takeaways
- Use Workbooks for:
- Unified performance/health dashboards
- Combining live metrics with diagnostic logs
- Team-sharable operational reports
- Use Notebooks for:
- Exploratory data analysis
- Machine learning prototyping
- Code-heavy collaborations (e.g., Python/R scripts)
- Innovation: Workbooks simplify monitoring by pre-packaging critical insights (no manual metric hunting).
Pro Tip: Start with predefined Workbooks templates, then customize with organization-specific KQL queries.
4-2 Azure Monitor Workbooks
🔍 Core Evolution
- Successor to "v1" VM Monitoring: Replaces manual guest OS diagnostics + Metrics Explorer
- Unified Solution: Integrates legacy Operations Management Suite (OMS) capabilities into Azure Monitor
🚀 Key Features
- Performance Dashboard
- Predefined views for critical metrics (CPU/memory/disk/network)
- Eliminates manual chart configuration in Metrics Explorer
- Map (Service Map)
- Visualizes dependencies between VMs/services
- Reveals:
- Active network connections (IPs/ports/protocols)
- Running processes and linked dependencies
- Bulk Configuration
- Auto-enable diagnostics across VMs via Azure Policy
- Centralized onboarding via Log Analytics workspace
⚙️ Requirements
- Log Analytics Workspace: Mandatory foundation (future-proofs monitoring)
- Agents: Automatic deployment during onboarding
- Log Analytics agent (data collection)
- Dependency agent (dependency mapping)
💡 Strategic Value
- Proactive Insights: Detect bottlenecks/dependencies before outages
- Operational Efficiency:
- Replace custom dashboards with out-of-box views
- Automate monitoring at scale (via policies)
- Unified Experience: Accessible from:
- Individual VM blades
- Azure Monitor hub
Demo Highlight: Showcases how to replace fragmented monitoring with a single-pane solution.
🔄 Migration Note
- OMS Transition: Original "Service Map" now fully integrated as the "Map" feature
- Adoption Incentive: Microsoft’s recommended path for VM monitoring
4-3 Azure Monitor for VMs
Here's a concise summary of Azure Monitor for VMs (Virtual Machine Insights):
🔄 Evolution from Legacy Monitoring
- Replaces "v1" VM monitoring (manual guest OS diagnostics + Metrics Explorer)
- Integrates former Operations Management Suite (OMS) capabilities
- Requires a Log Analytics workspace (foundation for modern monitoring)
🖥️ Core Features
- Performance Dashboard
- Predefined views for critical metrics (CPU/memory/disk/network)
- Eliminates manual chart configuration
- Map (Service Map)
- Visualizes dependencies between VMs/services
- Reveals:
- Live network connections (IPs/ports/protocols)
- Running processes and dependencies
⚡ Key Advantages
- Bulk Configuration:
- Auto-enable monitoring across VMs via Azure Policy
- Centralized onboarding (portal/API/templates)
- Unified Access:
- Available from individual VM blades and Azure Monitor hub
- Future-Proof:
- Microsoft's strategic direction for VM monitoring
⚙️ Deployment Workflow
graph LR
A[Log Analytics Workspace] --> B[Enable Insights]
B --> C[Performance Dashboard]
B --> D[Service Map]
B --> E[Azure Policy Integration]
Demo Highlight: Showcases seamless transition from legacy diagnostics to automated insights with dependency mapping.
💡 Why Adopt?
- Proactive Optimization: Identify bottlenecks before outages
- Operational Efficiency: Replace fragmented tools with a single pane
- Enterprise Scale: Manage 1000s of VMs via policy-driven enforcement
4-4 Demo: Enable Azure Monitor for VM
⚙️ Onboarding Methods
- Per-VM Enablement:
- Navigate to VM → Monitoring → Insights → Enable
- Select Log Analytics workspace
-
Automatically deploys:
- Log Analytics agent (metrics/logs)
- Dependency agent (Service Map)
-
Bulk Enablement:
- Use Azure Monitor hub → Virtual Machines
- View monitored/unmonitored VMs
- Configure workspace assignment
- Leverage Azure Policy/REST API/ARM templates for automation
🔍 Key Features Enabled
| Feature | Purpose |
|---|---|
| Performance | Prebuilt dashboards for CPU/memory/disk/network |
| Map (Service Map) | Visualize dependencies between VMs/services (ports/protocols/connections) |
⚠️ Critical Notes
- Multi-Homing Support: VMs can report to multiple workspaces (advanced scenario)
- Agent Requirements:
- Windows: Event logs, IIS, crash dumps
- Linux: Syslog data
- Legacy vs. Modern:
- Old method: "Guest OS diagnostics" (storage account-based)
- New standard: Insights (Log Analytics-centric)
🚀 Workflow Comparison
graph LR
A[VM Monitoring] --> B[Traditional Method]
A --> C[Modern Method]
B --> D[Enable Guest OS diagnostics<br>per VM]
C --> E[Enable Insights<br>per VM or at scale]
E --> F[Azure Monitor hub]
E --> G[Azure Policy]
💡 Key Takeaways
- Centralization: Log Analytics workspace is now the monitoring backbone
- Scale Matters: Use Azure Monitor hub for enterprise deployments (100s of VMs)
- Dependency Mapping: Service Map reveals hidden infrastructure relationships
- Future-Proof: Insights replaces legacy diagnostics (Microsoft's strategic path)
Pro Tip: Start with Insights onboarding via Azure Policy to enforce monitoring standards across all VMs.
4-5 Demo: Integrate Azure Policy
⚙️ Azure Policy for Monitoring Automation
- Purpose:
- Enforce monitoring compliance at scale
- Automate deployment of monitoring agents
-
Enable Azure Monitor for VMs across environments
-
Key Built-in Initiatives:
- Enable Azure Monitor for VMs:
- Auto-deploys Log Analytics agent to Windows/Linux VMs
- Enable Azure Monitor for Scale Sets:
- Applies same monitoring to VM scale sets
🔧 Implementation Workflow
graph TD
A[Azure Policy → Definitions] --> B{Filter:}
B --> C[Category: Monitoring]
B --> D[Type: Built-in]
C --> E[Select Initiative]
E --> F[Assign to Scope]
- Navigate:
Policy > Authoring > Definitions - Filter:
- Category:
Monitoring - Type:
Built-in - Assign initiatives to:
- Management groups
- Subscriptions
- Resource groups
📦 Initiative Components
| Initiative | Policies Included |
|---|---|
| Enable Azure Monitor for VMs | - Deploy Log Analytics agent (Windows) |
| - Deploy Log Analytics agent (Linux) | |
| Enable for Scale Sets | - Equivalent policies for VM scale sets |
💡 Key Benefits
- Zero-Touch Onboarding: Automates agent deployment
- Consistency: Ensures 100% VM monitoring coverage
- Remediation: Auto-fixes non-compliant resources
- Governance Integration: Part of broader Azure governance framework
Pro Tip: Combine with Azure Monitor's "Insights" onboarding for end-to-end monitoring enforcement. Assign initiatives at management group level for enterprise-wide coverage.
4-6 Demo: View Azure Monitor VM Data
⚙️ Onboarding Workflow
- Bulk Enablement:
- From Azure Monitor → Virtual Machines view
- Identify non-monitored VMs across subscriptions/resource groups
- Select VMs → "Enable" → Choose existing Log Analytics workspace
-
Critical Note: Avoid accidentally creating new workspaces (demo mishap)
-
Per-VM Method:
- VM blade → Insights → Select workspace → Enable
- Auto-deploys agents (Log Analytics + Dependency agents)
📊 Performance Dashboard
- Prebuilt Metrics Visualization:
- CPU/Memory/Disk/Network charts across multiple VMs
- Interactive tooltips show per-VM values
- Aggregation options: Min/Max/Avg/Percentiles
- Advantage vs. Metrics Explorer:
- No manual configuration required
- Unified view of critical metrics
🌐 Service Map (Dependency Visualization)
| Feature | Value |
|---|---|
| Connections | Live inbound/outbound links (IPs/ports/protocols) |
| Processes | Running services (e.g., 22 processes on spot1 in demo) |
| Dependency Mapping | Critical for migrations (identify all dependencies pre-move) |
Example:
- spot1 showed 11 external connections on port 443
- Azure DNS names revealed cloud dependencies
🔑 Key Insights
- Scalability:
- Onboard 100s of VMs via Azure Monitor hub (not just per-VM)
- Migration Safety:
- Service Map prevents post-move outages by exposing hidden dependencies
- Hybrid Support:
- Works with Azure Arc-enabled on-premises servers
- Includes VM scale sets
- Workbook Integration:
- All views are prebuilt Azure Workbooks (customizable)
Pro Tip: Use Service Map before ANY VM migration/change to audit connections. Combine with Azure Policy for auto-remediation of unmonitored resources.
4-8 Where You See KQL
🔍 KQL Essentials
- Origin & Purpose:
- Named after explorer Jacques Cousteau (homophone "Kusto")
- Designed as a data exploration language for large-scale analytics
- Internally used by Microsoft for years before public release
⚙️ Key Azure Services Using KQL
| Service | Use Case |
|---|---|
| Azure Log Analytics | Query logs across Azure/hybrid resources (primary interface) |
| Application Insights | Analyze application performance/traces |
| Azure Sentinel (SIEM) | Investigate security threats/incidents |
| Azure Data Explorer (ADX) | High-speed data exploration on petabyte-scale datasets |
💡 Strategic Value
- Certification & Career:
- Critical for Azure certification exams
- High-value industry skill for cloud monitoring/security roles
- Unified Language:
- Single syntax across monitoring/security/data services
- Performance:
- Optimized for fast queries on massive datasets (billions of records)
🌐 Azure Data Explorer (ADX) Notes
- Web-based service (not desktop app)
- Uses compute clusters for parallel query processing
- Supports both SQL and KQL interfaces
- Handles petabyte-scale data exploration
💡 Pro Tip: Mastering KQL unlocks deep insights across Azure's monitoring ecosystem – prioritize learning its core operators (
where,summarize,join,render).
StormEvents
| limit 100
Azure Data Explorer (ADX)